 Trade Data
 15-04-2025
In 2023, the total global value of chickpea exports reached $2.14 billion USD, encompassing shipments from all exporting nations.
Compared to 2019, when worldwide chickpea exports stood at $1.3 billion, this figure reflects a significant 64.5% increase over the five-year period. On a year-on-year basis, global chickpea export revenue grew by 21.7%, rising from $1.76 billion in 2022.
Top Chickpea Exporters
The five dominant chickpea-exporting nations in 2023 were Australia, Russia, Türkiye, India, and Canada. Combined, these countries were responsible for 75.4% of all chickpea sales on the international market.
From a regional perspective, Asia emerged as the largest contributor to chickpea exports in terms of dollar value, shipping $629.3 million worth—29.4% of the global total. Oceania, led primarily by Australia, followed with a 21.1% share, while Europe accounted for 20.6% of international exports. North America and Africa contributed 18.3% and 8.7%, respectively.
A smaller proportion—1.9%—came from Latin American nations (excluding Mexico but including Caribbean countries).
For classification purposes, dried, shelled chickpeas are categorized under the 6-digit Harmonized Tariff System code 071320.
Primary Chickpea Import Markets
Shifting focus to imports, the top five chickpea-importing countries in 2023 were Pakistan, Türkiye, Bangladesh, India, and the United Arab Emirates. Together, these nations accounted for 54.5% of the total global chickpea import value.
This data indicates that chickpea exports are more centralized among a small group of suppliers (top 5 responsible for 75.4%), while imports are slightly more dispersed across buyers.
On a regional scale, Asia led all other continents, receiving 65.4% of the world's imported chickpeas. Trailing behind were Europe with a 14.9% share, followed by Africa (9.7%), North America (6.8%), and Latin America (2.9%), excluding Mexico but including the Caribbean. Oceania, driven mainly by New Zealand, represented the smallest share at just 0.2%.

Top Chickpeas Exports by Company in 2024
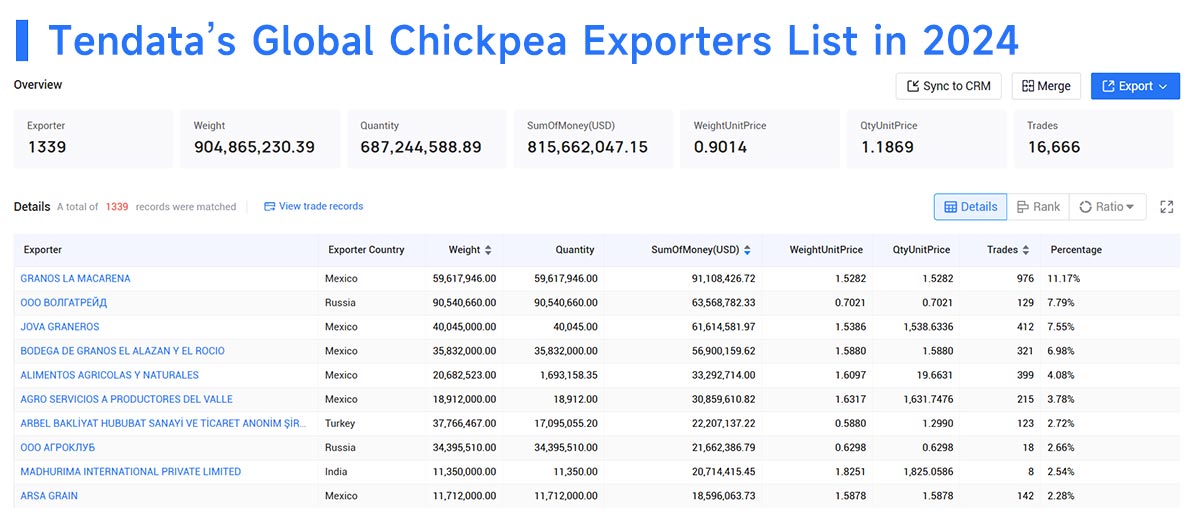
According to Tendata, the following 10 companies are expected to be the top 10 chickpeas exporters in the world by 2024:
1.GRANOS LA MACARENA(11.17%, $91.11 Million)
2.ООО ВОЛГАТРЕЙД(7.79%, $63.57 Million)
3.JOVA GRANEROS(7.55%, $61.61 Million)
4.BODEGA DE GRANOS EL ALAZAN Y EL ROCIO(6.98%, $56.9 Million)
5.ALIMENTOS AGRICOLAS Y NATURALES(4.08%, $33.29 Million)
6.AGRO SERVICIOS A PRODUCTORES DEL VALLE(3.78%, $30.86 Million)
7.ARBEL BAKLİYAT HUBUBAT SANAYİ VE TİCARET ANONİM ŞİRKETİ(2.72%, $22.21 Million)
8.ООО АГРОКЛУБ(2.66%, $21.66 Million)
9.MADHURIMA INTERNATIONAL PRIVATE LIMITED(2.54%, $20.71 Million)
10.ARSA GRAIN(2.28%, $18.6 Million)

Top Chickpeas Imports by Company in 2024
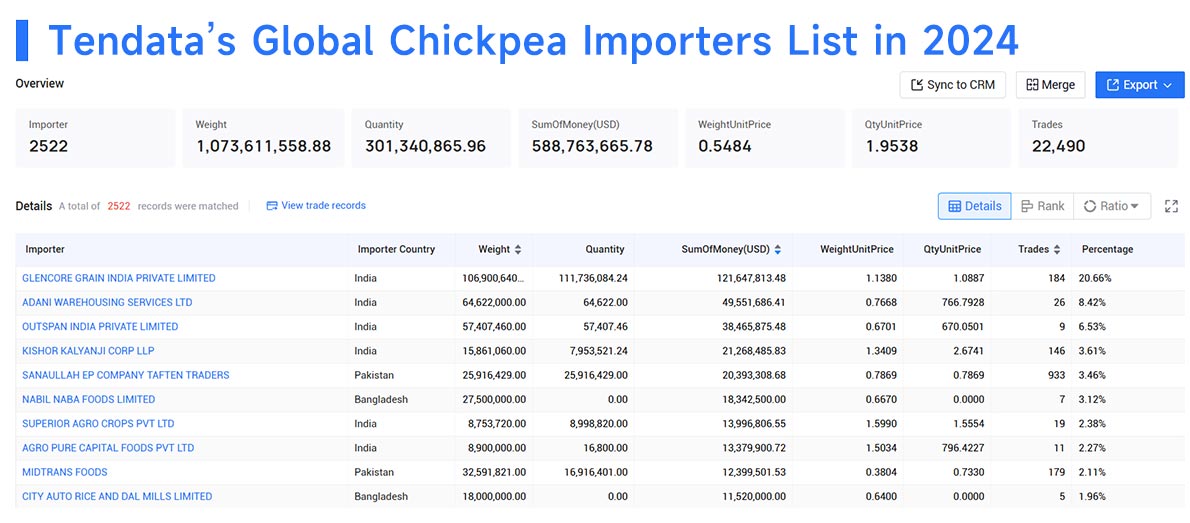
According to Tendata, the following 10 companies are expected to be the top 10 chickpeas importers in the world by 2024:
1.GLENCORE GRAIN INDIA PRIVATE LIMITED(20.66%, $121.65 Million)
2.ADANI WAREHOUSING SERVICES LTD(8.42%, $49.55 Million)
3.OUTSPAN INDIA PRIVATE LIMITED(6.53%, $38.47 Million)
4.KISHOR KALYANJI CORP LLP(3.61%, $21.27 Million)
5.SANAULLAH EP COMPANY TAFTEN TRADERS(3.46%, $20.39 Million)
6.NABIL NABA FOODS LIMITED(3.12%, $18.34 Million)
7.SUPERIOR AGRO CROPS PVT LTD(2.38%, $14 Million)
8.AGRO PURE CAPITAL FOODS PVT LTD(2.27%, $13.38 Million)
9.MIDTRANS FOODS(2.11%, $12.4 Million)
10.CITY AUTO RICE AND DAL MILLS LIMITED(1.96%, $11.52 Million)

Top Chickpeas Exports by Country
Below are the top 15 countries that exported the highest dollar value worth of chickpeas during 2023.
1.Australia: US$452.3 million (21.1% of total exported chickpeas)
2.Russia: $356.7 million (16.6%)
3.Türkiye: $294.2 million (13.7%)
4.India: $287.7 million (13.4%)
5.Canada: $226.5 million (10.6%)
6.United States: $106.4 million (5%)
7.Tanzania: $76.3 million (3.6%)
8.Sudan: $72.8 million (3.4%)
9.Mexico: $60.1 million (2.8%)
10.Argentina: $40.5 million (1.9%)
11.Ethiopia: $23.2 million (1.1%)
12.France: $18.9 million (0.9%)
13.Netherlands: $13.6 million (0.6%)
14.Belgium: $12.4 million (0.6%)
15.Egypt: $11.6 million (0.5%)
By value, the listed 15 countries shipped 95.8% of globally exported chickpeas in 2023.
Among the top exporters, the fastest-growing chickpeas exporters since 2022 were: Sudan (up 428%), Russia (up 112.9%), Ethiopia (up 86.2%) and the Netherlands (up 71.8%).
Major suppliers that posted declines in their exported chickpeas sales were: Mexico (down -57.2% from 2022), Tanzania (down -9.1%) and France (down -4.2%).
Top Chickpeas Imports by Country
The overall cost for imported chickpeas recorded for 2023 was $2.34 billion, inflating by 68.1% over the 5-year period starting from $1.39 billion five years earlier in 2019. Year over year, the value of imported chickpeas expanded by 34.5% compared to $1.74 billion for 2022.
Below are the 15 best buying markets as measured by the highest dollar value worth of chickpeas imported during 2023.
1.Pakistan: US$492.1 million (21.1% of total imported chickpeas)
2.Türkiye: $296.5 million (12.7%)
3.Bangladesh: $206.9 million (8.9%)
4.India: $172 million (7.4%)
5.United Arab Emirates: $106.3 million (4.5%)
6.Iraq: $92.4 million (4%)
7.Algeria: $88.5 million (3.8%)
8.United States: $84.1 million (3.6%)
9.Spain: $76.1 million (3.3%)
10.Italy: $61.4 million (2.6%)
11.United Kingdom: $51.6 million (2.2%)
12.Canada: $50.3 million (2.2%)
13.Egypt: $44.2 million (1.9%)
14.Jordan: $35.3 million (1.5%)
15.Sri Lanka: $31.1 million (1.3%)
By value, the listed 15 countries bought over four-fifths (80.8%) of globally imported chickpeas in 2023.
Among the top importers, the fastest-growing chickpeas importers since 2022 were: India (up 243.8%), Türkiye (up 171.8%), Spain (up 98.4%) and Sri Lanka (up 79.3%).
Major buyer countries that posted declines in their purchases of imported chickpeas were: Algeria (down -8.5% from 2022) and the United Arab Emirates (down -6.1%).
Tendata provides 850 million+ contact information for 500 million companies
in 228+ countries around the world, including phone number, email, LinkedIn, Facebook,
Instagram, Twitter, Youtube and other contact information. These contact
information are verified to ensure that you can contact customers.
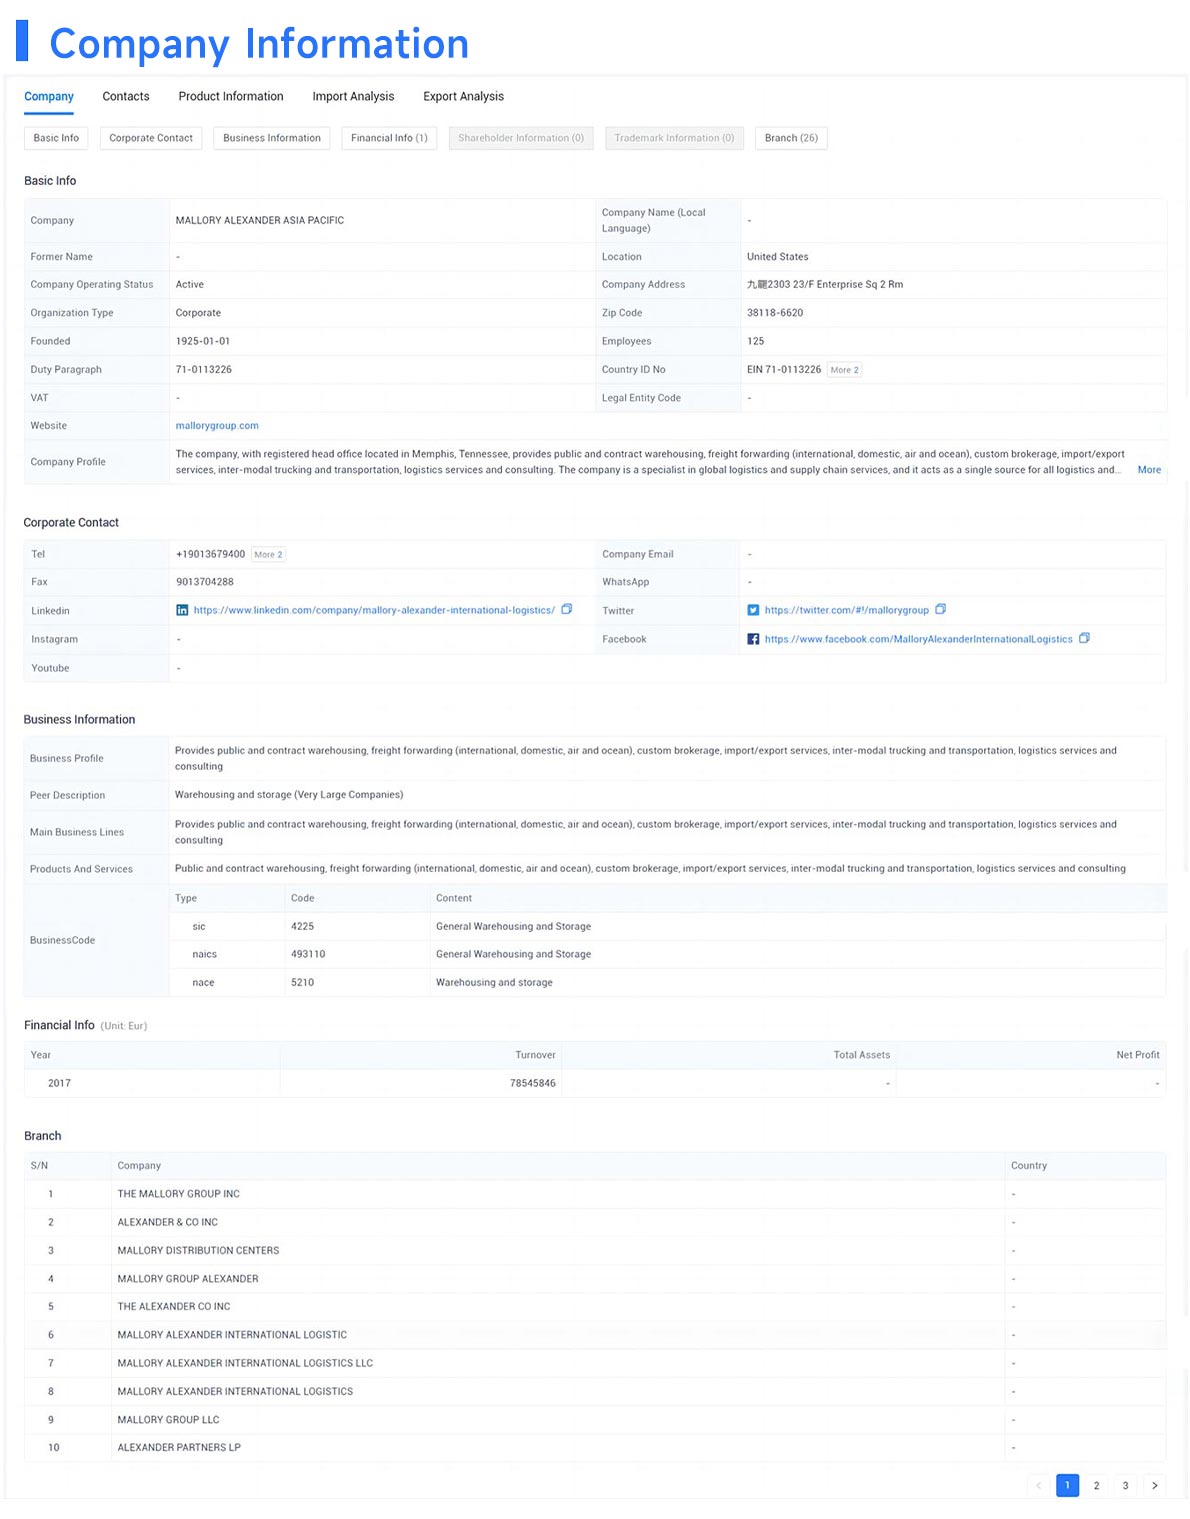
In addition, Tendata also provides basic information about companies, including branches, equity relationships, main products, business relationships, news and public opinion, intellectual property rights, etc. You can use this information to conduct background checks on companies.
Tendata also provides import or export analysis of companies, including trade trends, product HS codes, supply chain information, country of origin or country of supplier, ports, etc. You can track the latest developments of companies and find out if they have the latest needs.
We show you Tendata's corporate information cases: >>Request for Free Demo

Category
Leave Message for Demo Request or Questions


 T-info
 T-discovery

 My
Tendata
 Market Analysis
 Customer
Development
 Competitor
Monitoring
 Customer Relationship


