 Trade Data
 31-03-2025
In 2024, Japan's trade performance exhibited a complex interplay of record-high exports and sustained deficits, influenced by global demand shifts and currency fluctuations. Japan recorded a trade deficit of 5.33 trillion yen ($34 billion) in 2024, a 44% reduction from the previous year's deficit. This improvement was primarily driven by a 6.2% year-on-year increase in exports, reaching a record 107.09 trillion yen—the highest since data collection began in 1979. Tendata will unlock details of Japan trade data for you.

Key Export Products Driving Growth
Semiconductor Manufacturing Equipment
Exports of semiconductor-related equipment surged by 27.2% to 4.5 trillion yen. This growth was particularly driven by strong demand from China and other parts of Asia. Japan's high-tech exports in this category remain a significant part of its trade balance.
Automobiles
Exports of vehicles increased by 3.7% to a record 17.91 trillion yen. A large portion of the growth came from sales of hybrid vehicles to the United States, which remains one of Japan's largest markets for cars.
However, Japan's trade environment faces uncertainties, particularly with the U.S. administration's introduction of a 25% tariff on automobile imports. This policy poses significant risks to Japan's economy, given the substantial role of auto exports to the U.S. In response, Japan is considering various measures to address these trade challenges.
>>>>Click to Get Japan trade data
Electronic Components
Electronic components, particularly those used in consumer electronics, machinery, and other industrial sectors, were major contributors to Japan's export increase in 2024. Demand in Asia and North America continued to rise, driven by the digital transformation and technological advancements globally.
Chemical Products
Chemical products, including plastics, pharmaceuticals, and fertilizers, continued to be important in the export mix. Although not as large in total volume as other sectors, their steady demand supported Japan's export growth. Exports to China and other regions in Asia remained strong.
Industrial Machinery
Exports of industrial machinery saw consistent growth, driven by the expansion of manufacturing in countries across Asia and other emerging markets. Countries like China and India remained strong markets for this category, with increased infrastructure and production capabilities boosting demand.
>>>>Contact to Get Japan trade data

Trade with Key Regions
Asia: Exports to Asia grew by 8.3% to 56.87 trillion yen, driven by robust shipments of semiconductor manufacturing equipment and electronic components. Exports to China specifically rose by 6.2% to 18.87 trillion yen.
United States: Exports to the U.S. increased by 5.1% to 21.30 trillion yen, maintaining its status as Japan's largest export destination. This growth was fueled by higher exports of automobiles, particularly hybrid models, and auto parts.
European Union: Exports to the EU declined by 3.9% to 9.97 trillion yen, with decreases noted in automobile and steel exports.
Imports and Currency Influence
Imports rose by 1.8% to 112.42 trillion yen, ending a two-year decline. This uptick was driven by increased imports of personal computers from the U.S. and copper ore from Chile. The yen's average depreciation by 7.7% against the U.S. dollar in 2024 contributed to higher import costs, although it also enhanced export competitiveness.
>>>>Know More about Japan trade data
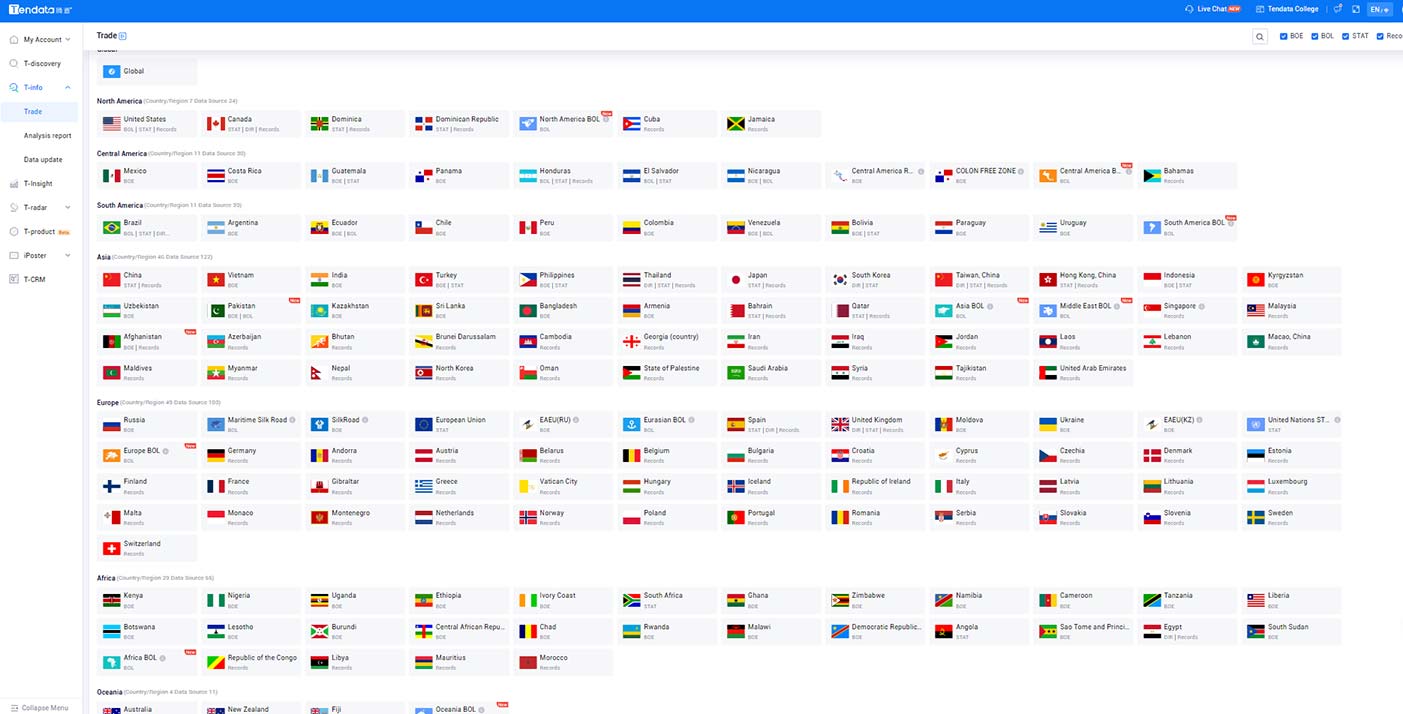
Tendata provides data interfaces for over 10 billion trade records in 228+ countries/regions, over 500 million in - depth enterprise data and over 850 million enterprise contact details. The labeled and clear data helps enterprises build a digital - intelligent middle - office.

1. Detailed descriptions of goods are provided.
2. Each transaction record includes company information for both the buyer and the seller, including company names and addresses.
3. Information about the notifier is provided, which is the party responsible for customs clearance and bill of lading procedures when the goods arrive at the port. This includes company names and addresses.
4. The weight, quantity, and packaging information, including container numbers, for the traded goods are displayed.
5. Country of origin and detailed port information, including ports of shipment, discharge, and shipping companies, are provided.
>>>Click to Get Free Access to Customs Data from 90+ Countries<<<
Category
Leave Message for Demo Request or Questions


 T-info
 T-discovery

 My
Tendata
 Market Analysis
 Customer
Development
 Competitor
Monitoring
 Customer Relationship


