 Trade Data
 26-08-2024
In 2022, the global expenditure on imported natural rubber reached a total of $18.54 billion.
Since 2018, the value of natural rubber imports worldwide has increased by 26.5%, up from $14.7 billion that year.
However, spending on imported natural rubber saw a decrease of 3.3% in 2022 compared to the $19.2 billion recorded in 2021.
The top 5 importers of natural rubber—Mainland China, the United States, Malaysia, Japan, and India—accounted for nearly 57% of the global natural rubber imports, reflecting a significant concentration of purchasing power among these countries.
From a regional perspective, Asian countries were the largest importers of natural rubber in 2022, with purchases totaling $10.9 billion, representing 58.7% of the global total. European buyers followed, accounting for 20.8%, while North America took 15.8% of the overall natural rubber imports.
Smaller portions were imported by Latin America (3.7%, excluding Mexico but including the Caribbean), Africa (1%), and Oceania (0.1%), primarily Australia and New Zealand.
For research purposes, the Harmonized Tariff System (HTS) code for natural rubber is 4001. This includes natural rubber, balata, gutta-percha, guayule, chicle, and similar natural gums in their primary forms.

Natural Rubber Imports by Country
Below are the top 15 countries that imported the highest dollar value of natural rubber in 2022.
1. China: $4 billion (21.7%)
2. United States: $2.4 billion (12.8%)
3. Malaysia: $1.6 billion (8.9%)
4. Japan: $1.5 billion (7.9%)
5. India: $1 billion (5.7%)
6. South Korea: $722.4 million (3.9%)
7. Turkey: $638 million (3.4%)
8. Germany: $578 million (3.1%)
9. Spain: $465.1 million (2.5%)
10. Brazil: $459.9 million (2.5%)
11. Vietnam: $432.9 million (2.3%)
12. Belgium: $339.2 million (1.8%)
13. Italy: $327.2 million (1.8%)
14. France: $295 million (1.6%)
15. Poland: $291.3 million (1.6%)
These 15 countries together accounted for more than 81.6% of all natural rubber imported in 2022.
Among them, the countries with the fastest-growing markets for natural rubber since 2021 were Turkey (up 19.8%), South Korea (up 16.8%), Poland (up 14.6%), and Spain (up 13.7%).
Meanwhile, some key suppliers saw declines in their natural rubber imports, with Vietnam (down 76.5% from 2021), Malaysia (down 6.9%), and France (down 2.8%) experiencing the most significant drops.
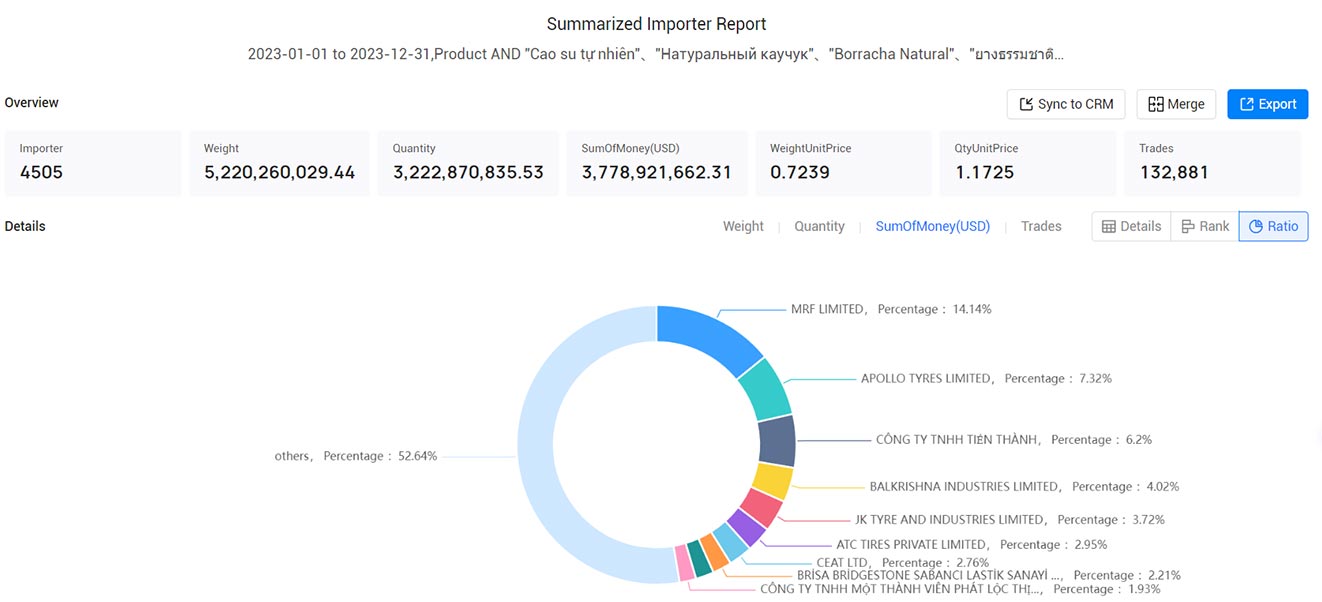
Natural Rubber Imports by Company in 2023
1. MRF LIMITED (14.14%, $534.44 million)
2. APOLLO TYRES LIMITED (7.32%, $276.62 million)
3. CÔNG TY TNHH TIẾN THÀNH (6.2%, $234.32 million)
4. BALKRISHNA INDUSTRIES LIMITED (4.02%, $151.84 million)
5. JK TYRE AND INDUSTRIES LIMITED (3.72%, $140.47 million)
6. ATC TIRES PRIVATE LIMITED (2.95%, $111.46 million)
7. CEAT LTD (2.76%, $104.44 million)
8. BRİSA BRİDGESTONE SABANCI LASTİK SANAYİ VE TİCARET ANONİM ŞİRKETİ (2.21%, $83.63 million)
9. CÔNG TY TRÁCH NHIỆM HỮU HẠN MỘT THÀNH VIÊN ĐỨC HIỀN QUẢNG TRỊ (2.11%, $79.57 million)
10. CÔNG TY TNHH MỘT THÀNH VIÊN PHÁT LỘC THỊNH (1.93%, $72.75 million)

"Customs data contains vast information, and extracting relevant customer contact details can be time-consuming, often yielding results that fall short of expectations. Is it really the case? Or is it because customs data is being utilized incorrectly, resulting in wasted effort and time?
Developing customers using customs data involves precisely characterizing all buyers and their procurement systems in the target market. This allows for the quick identification of the most compatible customers, discerning their credit systems and procurement details. It aids in defining high-quality customers and profit margins, enhancing development efficiency, and improving overall effectiveness. When using customs data to develop new customers, consider the following three approaches. (>>>Click to Get Free Access to Customs Data for 90+ Countries)

Category
Leave Message for Demo Request or Questions


 T-info
 T-discovery

 My
Tendata
 Market Analysis
 Customer
Development
 Competitor
Monitoring
 Customer Relationship


