 Trade Data
 12-03-2024
Chile's economy heavily relies on copper exports, constituting 45% of total sales. The most significant non-mineral product exports include manufacturing (36%), chemicals (9%), and agriculture/livestock, forestry, and fisheries (7%). The major export partners are China (40% of total sales), the United States (14%), Japan (8%), South Korea (6%), and Brazil (5%). Other countries include the Netherlands, Peru, Taiwan, and Mexico.

The latest Tendata iTrader data shows that, based on 2-digit HS codes,
Chile's top 10 export products in 2023 are:
1. Ores slag and ash (30.08%, $28.55 Billion)
2. Copper (20.77%, $19.72 Billion)
3. Inorganic chemicals, precious metal compound, isotope (10.06%, $9.55 Billion)
4. Fish, crustaceans, molluscs, aquatic invertebrates (7.7%, $7.31 Billion)
5. Edible fruits, nuts, peel of citrus fruit, melons (7.45%, $7.07 Billion)
6. Pulp of wood, fibrous cellulosic material, waste (2.81%, $2.67 Billion)
7. Wood and articles of wood, wood charcoal (2.33%, $2.21 Billion)
8. Mineral fuels, oils, distillation products (1.8%, $1.71 Billion)
9. Beverages, spirits and vinegar (1.64%, $1.56 Billion)
10. Pearls, precious stones, metals, coins (1.63%, $1.55 Billion)
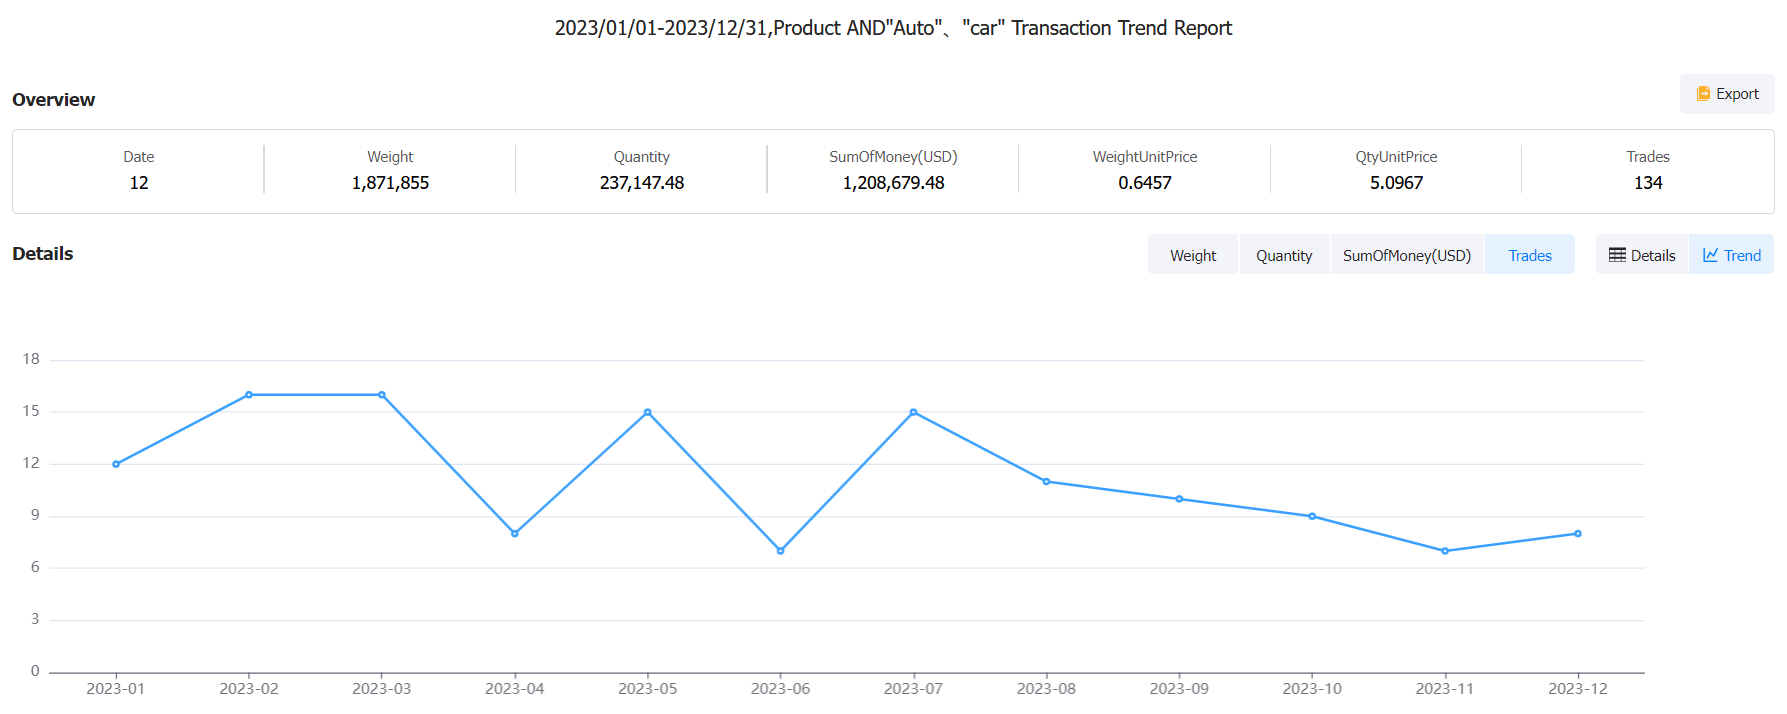
When you need to understand the market in Chile, you can use Tendata's Chile Export Database to search by product name or HS code to get market trends for the entire industry. With these Chile Export Databases, you can conduct market analysis quickly. The following is a sample query for you (data as of December 2023):

The latest Tendata iTrader data shows that Chile's top 10 export partners
are:
1. China (40.16%, $37.45 Billion)
2. United States (15.35%, $14.31 Billion)
3. Japan (7.29%, $6.8 Billion)
4. South Korea (6.46%, $6.02 Billion)
5. Brazil (4.59%, $4.28 Billion)
6. Mexico (1.88%, $1.75 Billion)
7. Netherlands (1.74%, $1.62 Billion)
8. Peru (1.67%, $1.56 Billion)
9. India (1.62%, $1.51 Billion)
10. Bolivia (1.53%, $1.43 Billion)
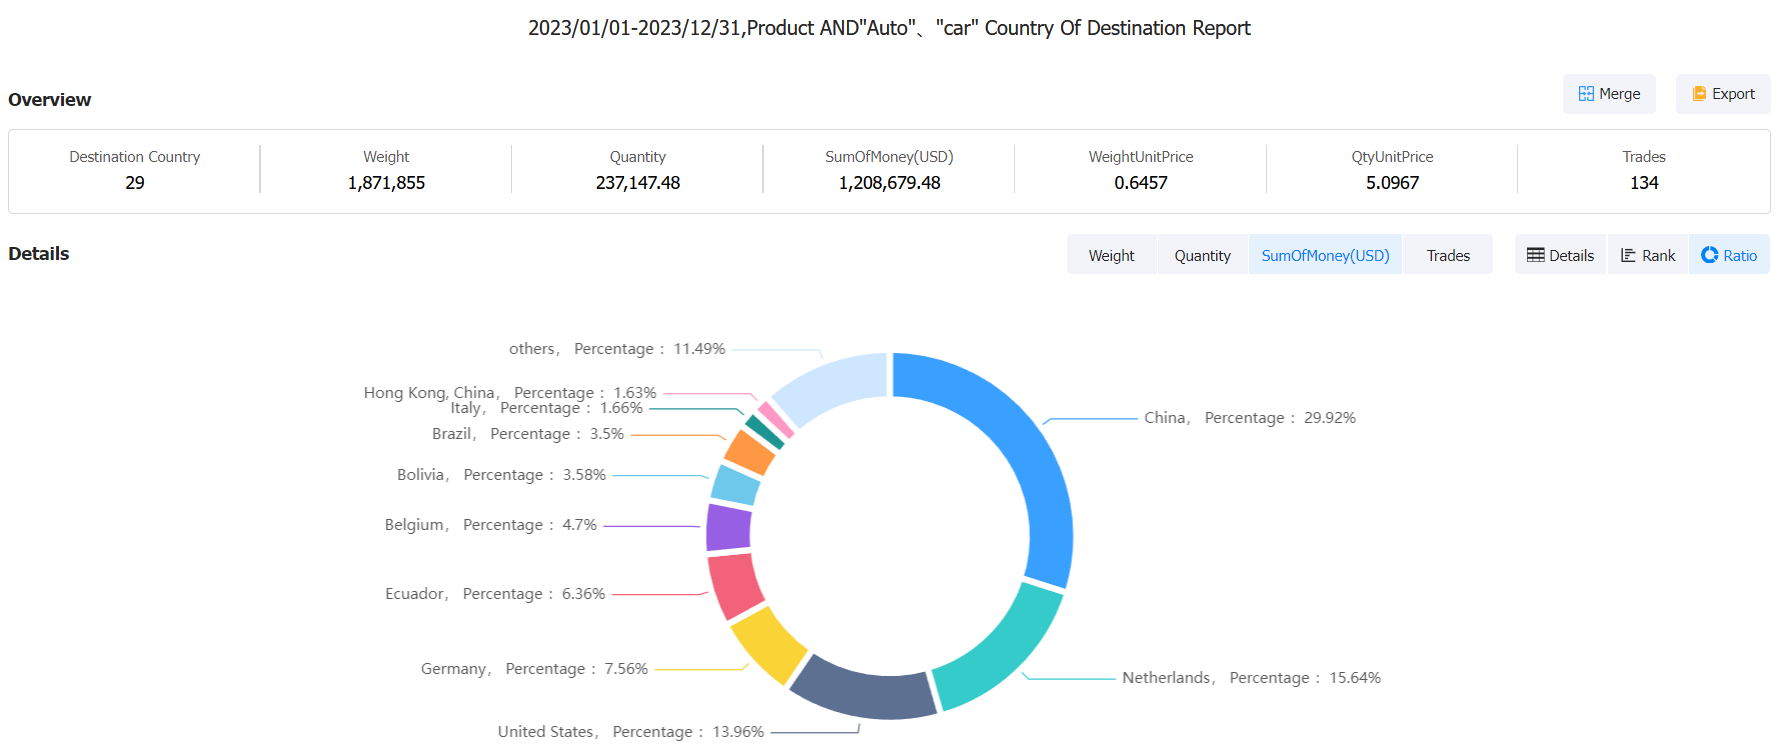
When you want to know if Chilean exporters tend to work with importers from your country, you can search by country name in Tendata's Chile Export Database. In addition to the above, Tendata also supports searches by exporter name, exporter address, port of departure, port of destination, bill of lading, weight, quantity, number of containers, and size. You can see that all these fields are available in the Chile Export Database. Don't forget to select a time range to get the latest import and export data. The following is a sample query for you (data as of December 2023):

Expand your export business in Chile using customs data and appropriate market intelligence.
Our Chile trade data covers companies, products, and other detailed customs information. Every shipment detail of Chilean exports is useful for the entire industry. From exporters to logistics companies and other departments, Chile export data adds value to every business.
Why use the Chile Export Database?
According to the Chile Export Database, exporters can:
1. Quickly find potential buyers in the Chilean market.
2. Understand the market conditions and product demand in Chile.
3. Stay informed about the dynamics of your competitors and surpass them.
4. Drive data-driven, real-time updated marketing strategies.
5. Set long-term business goals and increase your export revenue in Chile.
Why choose Tendata's Chile Export Database?
Tendata connects trade data from 218 countries and regions, business data from 198 countries, and internet data from 172 countries. With a single search, it presents information on approximately 130 million active global buyers and suppliers, all of whom have real purchasing records and intentions, bringing together your high-quality customer base in 0.01 seconds and saving you a significant amount of time.
If you are a marketer or trader eager to increase your exports in Chile, please contact us immediately to obtain customs data from Chile for 218 countries/regions.
Category
Leave Message for Demo Request or Questions


 T-info
 T-discovery

 My
Tendata
 Market Analysis
 Customer
Development
 Competitor
Monitoring
 Customer Relationship


