 Trade Data
 01-03-2024
China is the world's largest exporter. In 2023, mainland China exported products worth $33.89 trillion globally. The export value decreased by -5.7% compared to $35.94 trillion in 2022 but showed a significant increase of 35.6% compared to $24.98 trillion in 2019.
When Facing Limitations in the Domestic Market, How Can You Expand into Overseas Markets?
Firstly, you need to identify high-profit regions for your products.
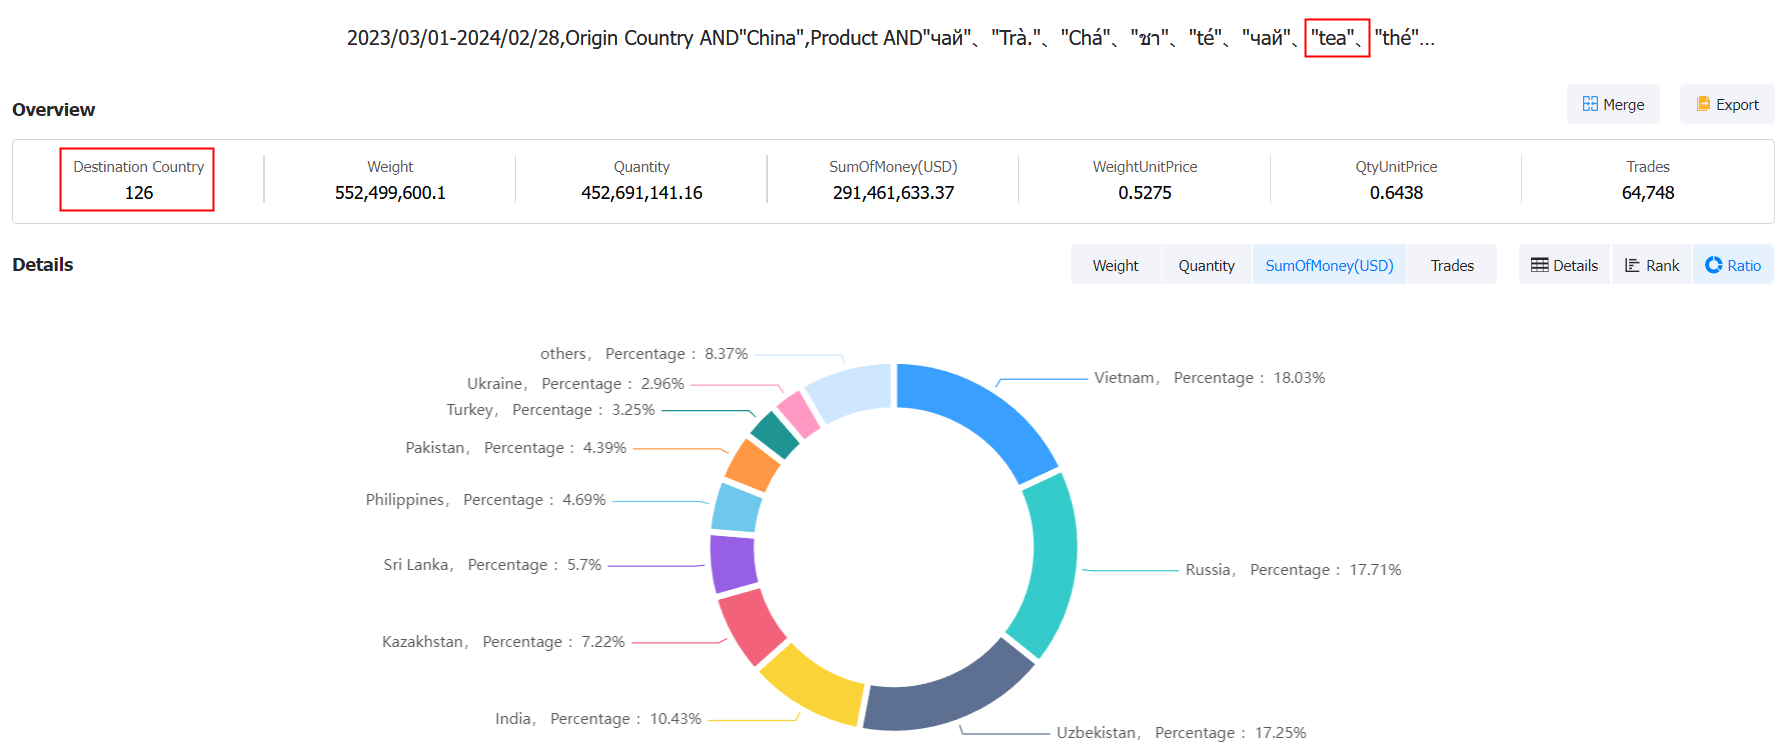
Not sure where to start? No worries—customs data can guide you! Simply input the product name in Chinese export data to see which countries import your products the most. As an example, let's query samples for tea:

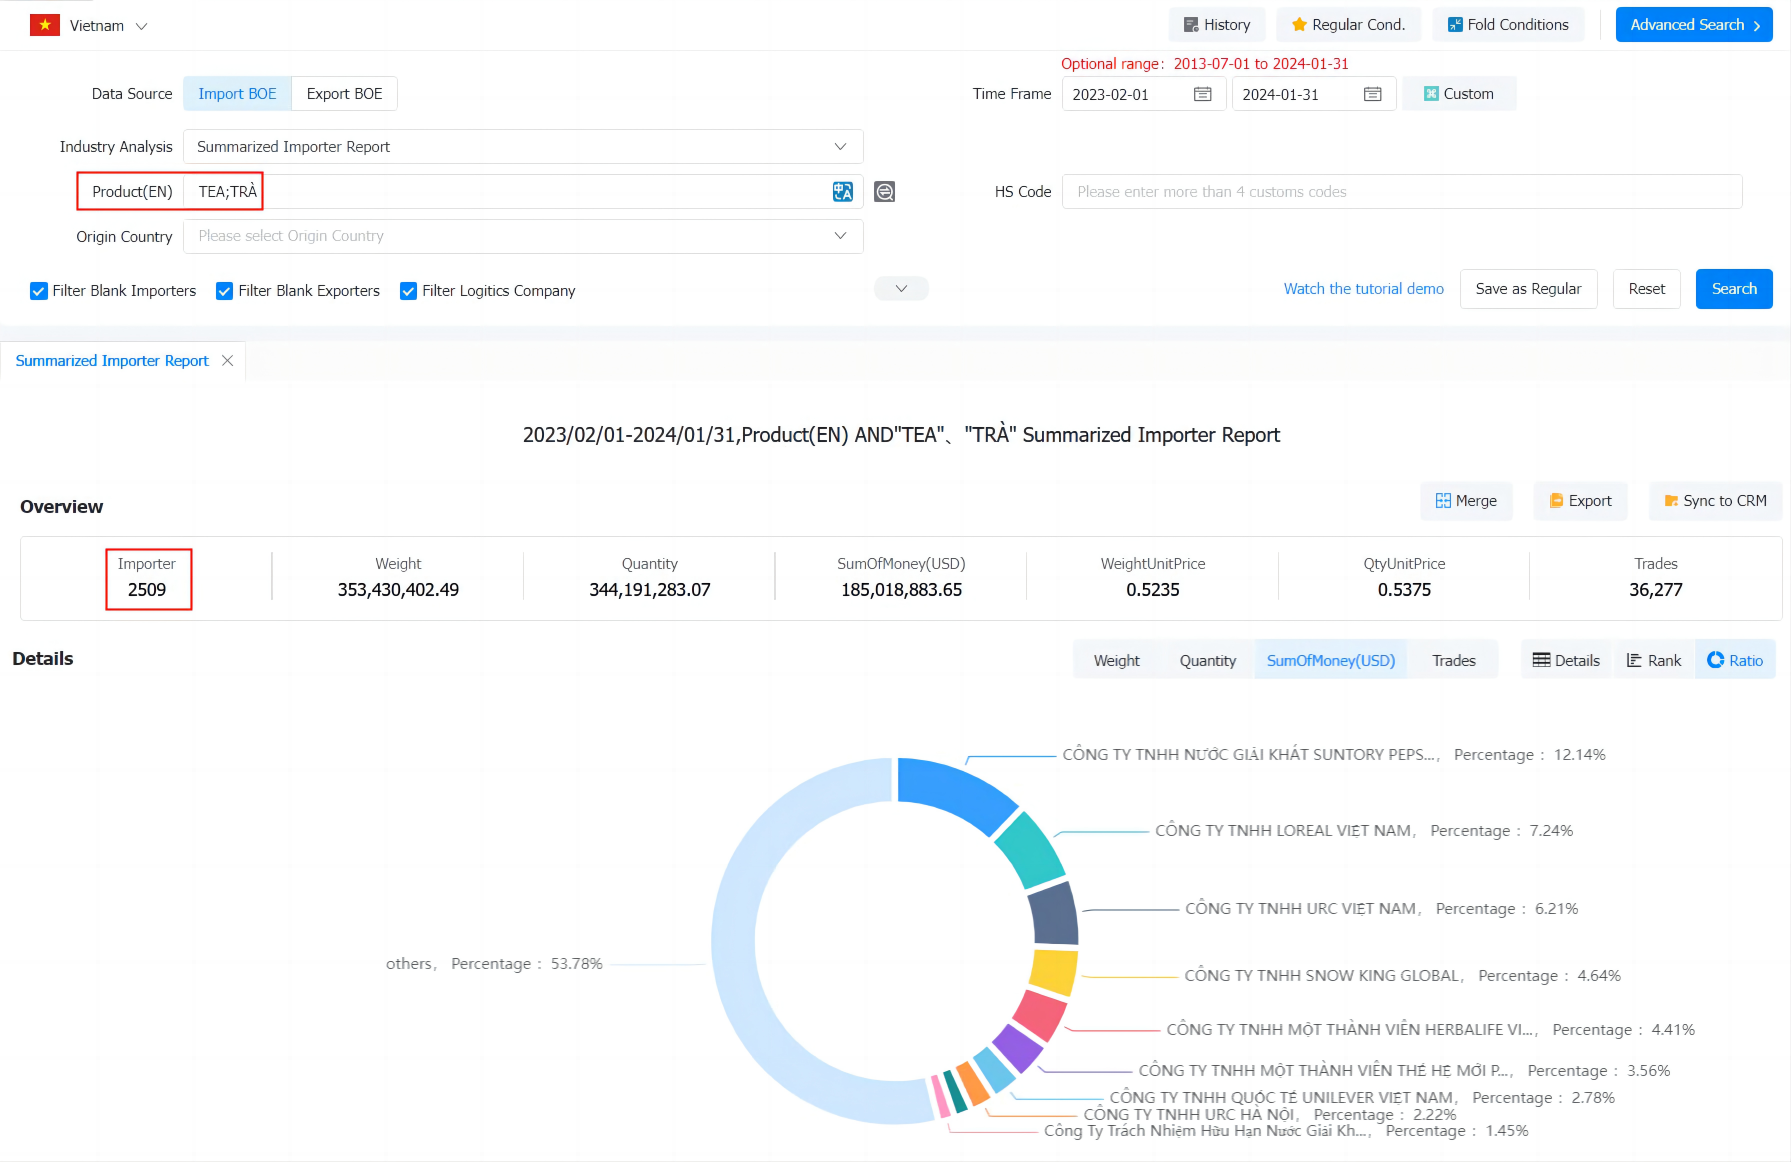
When you already have some knowledge about a country and want to tap into its market, you can use Chinese export data to find all importers from that country within the past year. Taking tea as an example, here's a sample query of Chinese export data:

If you're just starting in cross-border trade and are unsure about which country or product yields high profits and has a significant market demand, Chinese export data can assist you! Start by referring to Chinese export data to see which countries have higher export volumes, and then choose the products you want to focus on.
According to Chinese export data: From the mainland's perspective, almost half (47.8%) of China's exports go to other Asian countries, while 21.1% go to European importers. China ships goods to North American buyers worth 18.6%. The proportions are smaller for Africa (5.1%), Latin America (4.8%) (excluding Mexico but including the Caribbean region), Africa (4.6%), and Oceania (2.6%) (led by Australia and New Zealand).
Top Export Destinations for China
According to Chinese export data, here are the top 15 trading partners by export value in 2023. Additionally, it shows the percentage each importing country contributes to China's total exports:
1. United States: $5020 billion (14.8% of China's total exports)
2. Hong Kong: $2764 billion (8.2%)
3. Japan: $1576 billion (4.7%)
4. South Korea: $1493 billion (4.4%)
5. Vietnam: $1382 billion (4.1%)
6. India: $1178 billion (3.5%)
7. Russia: $1111 billion (3.3%)
8. Germany: $1006 billion (3%)
9. Netherlands: $1003 billion (3%)
10. Malaysia: $881 billion (2.6%)
11. Mexico: $815 billion (2.4%)
12. United Kingdom: $782 billion (2.3%)
13. Singapore: $776 billion (2.3%)
14. Thailand: $759 billion (2.2%)
15. Australia: $740 billion (2.2%)
The above 15 importing countries account for nearly two-thirds (62.8%) of China's total exports in 2023. Among them, two countries increased their imports from mainland China: Russia (a growth of 45.9% compared to 2022) and Mexico (a growth of 5.1%).
Netherlands (a decrease of -14.8%), the United States (a decrease of -13.9%), and Germany (a decrease of -13.4%) experienced double-digit declines year-on-year.
Expanding the scope to cover China's top 100 export customers, the fastest-growing buyers compared to 2022 include Belarus (78.1% growth), Tajikistan (65.7% growth), Uzbekistan (65.2% growth), Libya (65.1% growth), Algeria (51.3% growth), Kazakhstan (51% growth), and Russia (45.9% growth).
The countries experiencing the largest decline in purchasing Chinese export products are Norway (a -32% decrease compared to 2022), Finland (a -28.3% decrease), Switzerland (a -24.9% decrease), Pakistan (also a -24.9% decrease), followed by Ireland (a -21.7% decrease).
Category
Leave Message for Demo Request or Questions


 T-info
 T-discovery

 My
Tendata
 Market Analysis
 Customer
Development
 Competitor
Monitoring
 Customer Relationship


