 Trade Data
 29-02-2024
Southeast Asia's largest economy and the world's most populous Muslim nation are located in Indonesia, a country comprising thousands of islands between Asia and Australia. According to Indonesia's import data, Indonesia has experienced a substantial increase in import business in recent years, solidifying its position as one of Asia's largest economies.

Indonesia Import Data 2023:
Indonesia's import data reveals that the value of imported goods in 2023 reached $237.4 billion, a 25.8% increase from $188.7 billion in 2018. The total cost of Indonesia's imports increased by 21.3% compared to $195.7 billion in 2021. Calculated at the average exchange rate in 2023, the Indonesian Rupiah's value against the US Dollar has decreased by -4.3% since 2018, representing a -3.8% decline from 2021 to 2023.
Leading Suppliers of Imported Goods to Indonesia:
According to the latest Indonesia import data, the top exporters to Indonesia are China (28.5% of total imports), Singapore (8.2%), Japan (7.2%), Malaysia (5.3%), South Korea (4.94%), the United States (4.92%), Thailand (4.6%), Australia (4.2%), India (3.9%), Saudi Arabia (2.3%), Vietnam (2%), and Taiwan (1.9%). These countries collectively account for over 70% (78%) of Indonesia's total imports.
From a continental perspective, by value, 74.8% of Indonesia's imports come from Asian countries. According to Indonesia's import data, 6.8% of imports are from European countries, and 6.3% are from North America. A smaller portion of Indonesia's imports, 4.3%, comes from Africa, 3% from Latin America (excluding Mexico but including the Caribbean), and 4.8% from Australia and other Oceania regions.
Basic Trade Analysis Using Indonesia Import Data: Indonesia, with a population of 274.9 million, recorded an import total of
$237.4 billion in 2022, translating to approximately $860 per person per year in
commodity demand. This amount is higher than the per capita figure of $720 in
2021.
Top 10 Imported Goods in Indonesia:
The following product categories will constitute a significant portion of Indonesia's import expenditure in 2023, along with the percentage each category contributes to Indonesia's total imports. Here are the top 10 imported products in Indonesia:
1. Petroleum and other mineral fuels: $44.9 billion (18.9% of total imports).
2. Computers and electronic equipment: $31.6 billion (13.3%).
3. Electrical machinery and equipment: $26.4 billion (11.1%).
4. Iron and steel: $13.9 billion (5.9%).
5. Plastics: $11.1 billion (4.7%).
6. Transportation: $9.5 billion (4%).
7. Organic chemicals: $7.7 billion (3.2%).
8. Food industry and waste from animal feeding: $4.6 billion (1.9%).
9. Cereal: $4.5 billion (1.9%).
10. Iron and steel products: $4 billion (1.7%).
Why International Exporters Need Indonesia Import Data?
Based on Indonesia's import data, international exporters can:
1. Quickly identify potential customers in the Indonesian market.
2. Understand market conditions and product demands in Indonesia.
3. Stay informed about competitors' dynamics and surpass them.
4. Implement data-driven, real-time updated marketing strategies.
5. Establish long-term business goals and increase import revenue in Indonesia.
Why Choose Tendata's Indonesia Import Data?
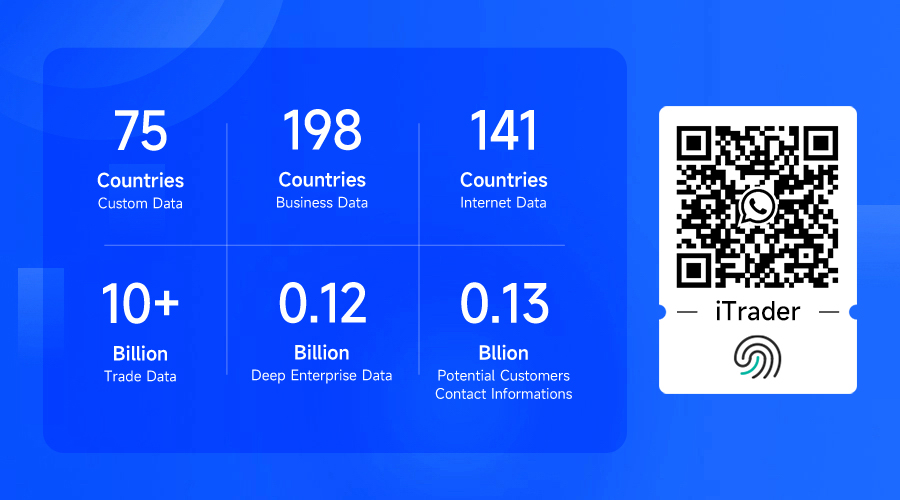
Tendata provides access to trade data from 218 countries and regions, business data from 198 countries, and internet data from 172 countries. With a single search, it presents information on approximately 130 million globally active buyers and suppliers, all with authentic purchasing records and intentions, allowing your premium customer base to converge in 0.01 seconds and saving you a significant amount of time.
If you are a marketer or trader eager to boost your company's sales in Indonesia, contact us immediately for access to import data from Indonesia spanning 218 countries/regions. Visit our website at tendata.com or send an email to emarketing@tendata.cn for more information.

Category
Leave Message for Demo Request or Questions


 T-info
 T-discovery

 My
Tendata
 Market Analysis
 Customer
Development
 Competitor
Monitoring
 Customer Relationship


