 Trade Data
 31-01-2024
Peru's merchandise exports totaled $58 billion in 2022. Peru's Merchandise Exports are up 3.39% from $56 billion in 2021.
The latest Tendata iTrader data shows Peru's top 10 exports, based on the 2-digit HS code, are:
· 26 (32.0%, 19.1 billion):Ores, slag and ash
· 71 (13.1%, 7.66 billion):Natural or cultured pearls, precious or semi-precious stones, precious metals, metals clad with precious metal and articles thereof; imitation jewelry; coin
· 27 (10.6%, 6.21 billion):Mineral fuels, mineral oils and products of their distillation; bituminous substances; mineral waxes
· 08 (8.07%, 4.69 billion):Edible fruit and nuts; peel of citrus fruit or melons
· 74 (5.69%, 3.31 billion):Copper and articles
· 23 (3.58%, 2.08 billion):Residues and waste from the food industries; prepared animal feed
· 09 (2.42%, 1.41 billion):Coffee, tea, matT and spices
· 61 (2.22%, 1.29 billion):Articles of apparel and clothing accessories, knitted or crocheted
· 03 (2.17%, 1.26 billion):Fish and crustaceans, molluscs and other aquatic invertebrates
· 79 (1.71%, 1.00 billion):Zinc and articles
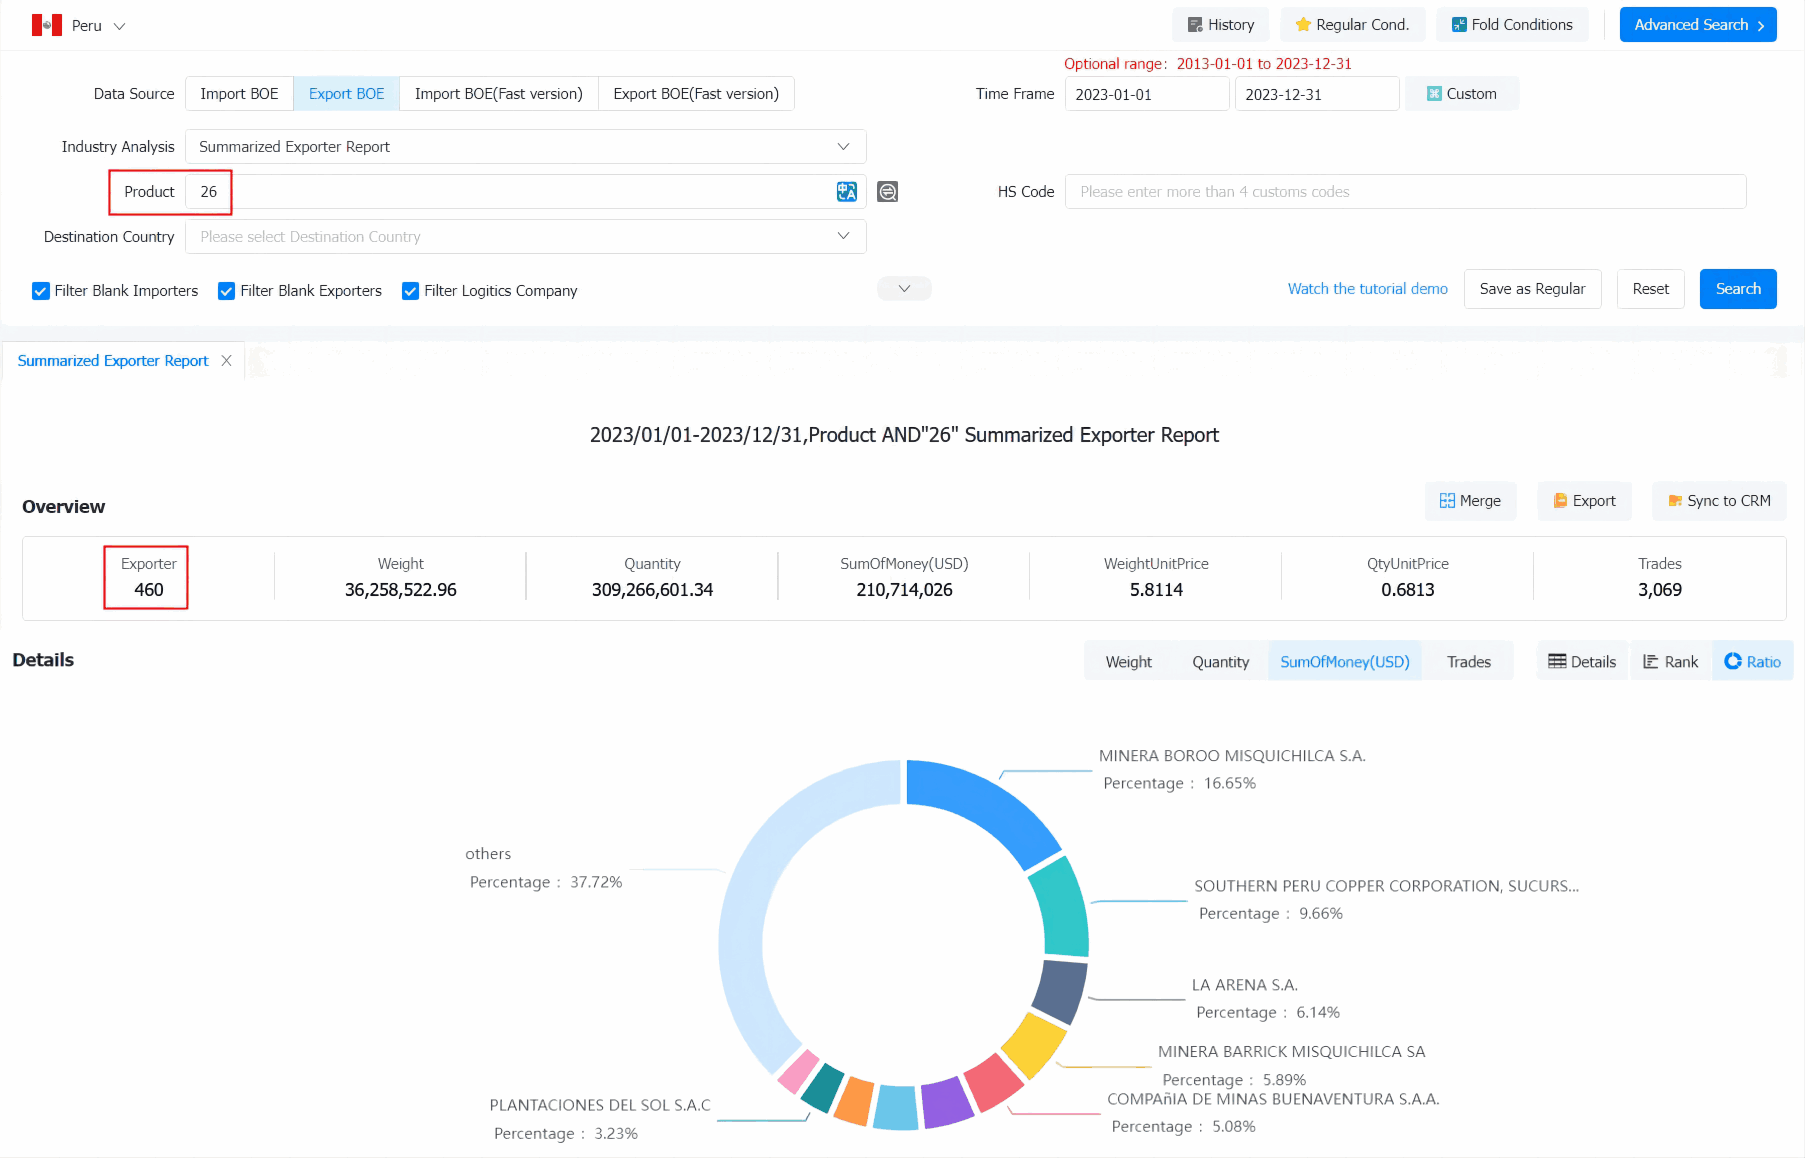
When you need to analyze the market for the Peru industry, you can find the latest Peru Exports Data in Tendata's Import/Export database by product name or 2-digit HS code, a sample of which is shown below (data as of January 2024) for you:

According to Tendata iTrader's more granular 4-digit HS codes, the top 10 Peru exports (subcategories) are:
· 2603 (23.0%, $13.4 billion):Copper ores and concentrates
· 7108 (12.6%, $7.36 billion):Gold (including gold plated with platinum) unwrought or in semi-manufactured forms, or in powder form
· 2711 (5.31%, $3.09 billion):Petroleum gases and other gaseous hydrocarbons
· 7403 (4.27%, $2.48 billion):Refined copper and copper alloys, unwrought
· 2710 (4.14%, $2.41 billion):Petroleum oils and oils from bituminous minerals, not crude; preparations n.e.c. containing by weight 70% or more of petroleum oils or oils from bituminous minerals; these being the basic constituents of the preparations; waste oils
· 2301 (3.06%, $1.78 billion):Flours, meals and pellets, of meat or meat offal, of fish or of crustaceans, molluscs or other aquatic invertebrates, unfit for human consumption; greaves
· 2608 (2.64%, $1.53 billion):Zinc ores and concentrates
· 2601 (2.63%, $1.53 billion):Iron ores and concentrates, including roasted iron pyrites
· 0810 (2.46%, $1.43 billion):Other fruit, fresh
· 0806 (2.22%, $1.29 billion):Grapes, fresh or dried
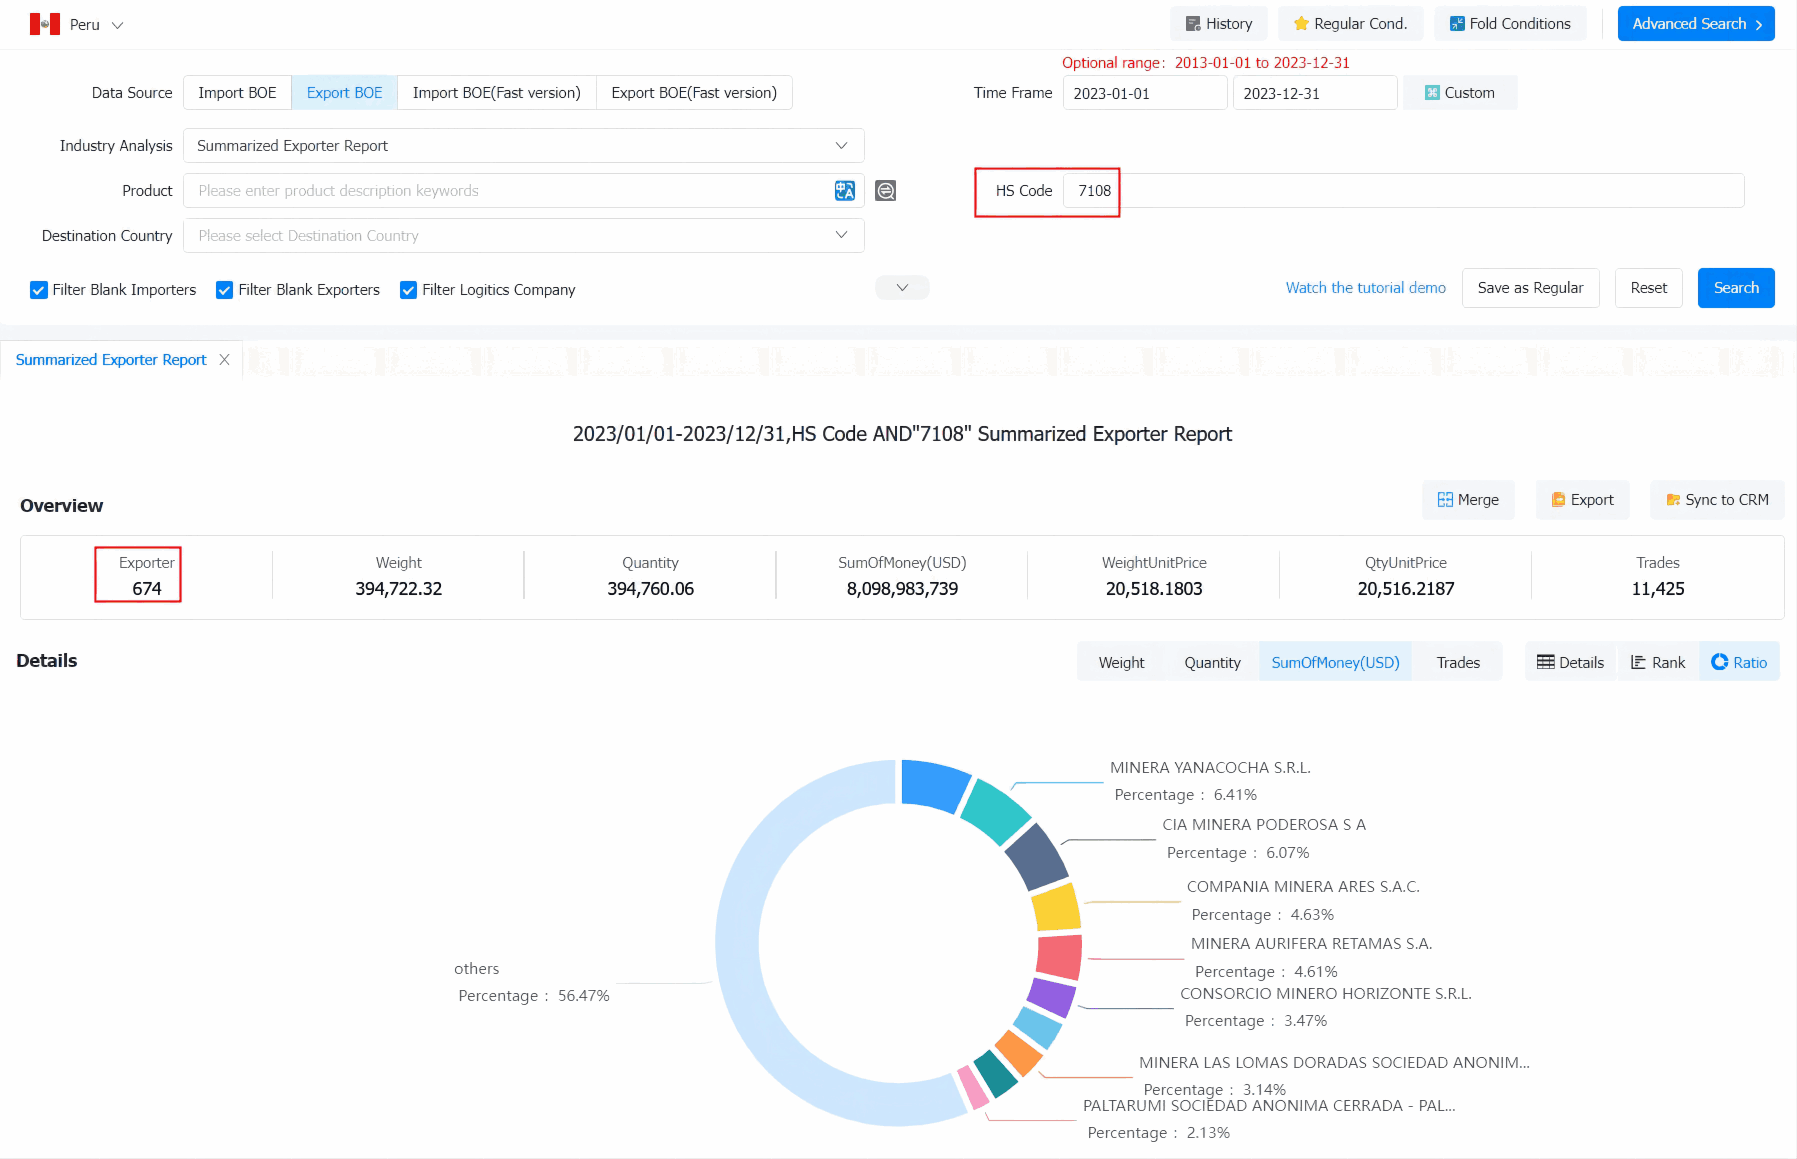
When you need to check Peru potential customers for your products, you can find the latest Peru Exports Data in Tendata's Import/Export database by following the 4-digit HS code.Below is a sample of what is available for you (data as of January 2024):

The latest Tendata iTrader data shows that Peru's main export partners are:
1. China (30%, 17.4 billion US$)
2. USA (14.4%, 8.43 billion US$)
3. Japan (4.85%, 2.82 billion US$)
4. Canada (4.51%, 2.62 billion US$)
5. Korea (4.47%, 2.6 billion US$)
6. India (3.78%, 2.2 billion US$)
7. Switzerland (3.41%, 1.98 billion US$)
8. United Kingdom (3.33%, 1.94 billion US$)
9. Chile (3.13%, 1.82 billion US$)
10. Netherlands (2.99%, 1.74 billion US$)
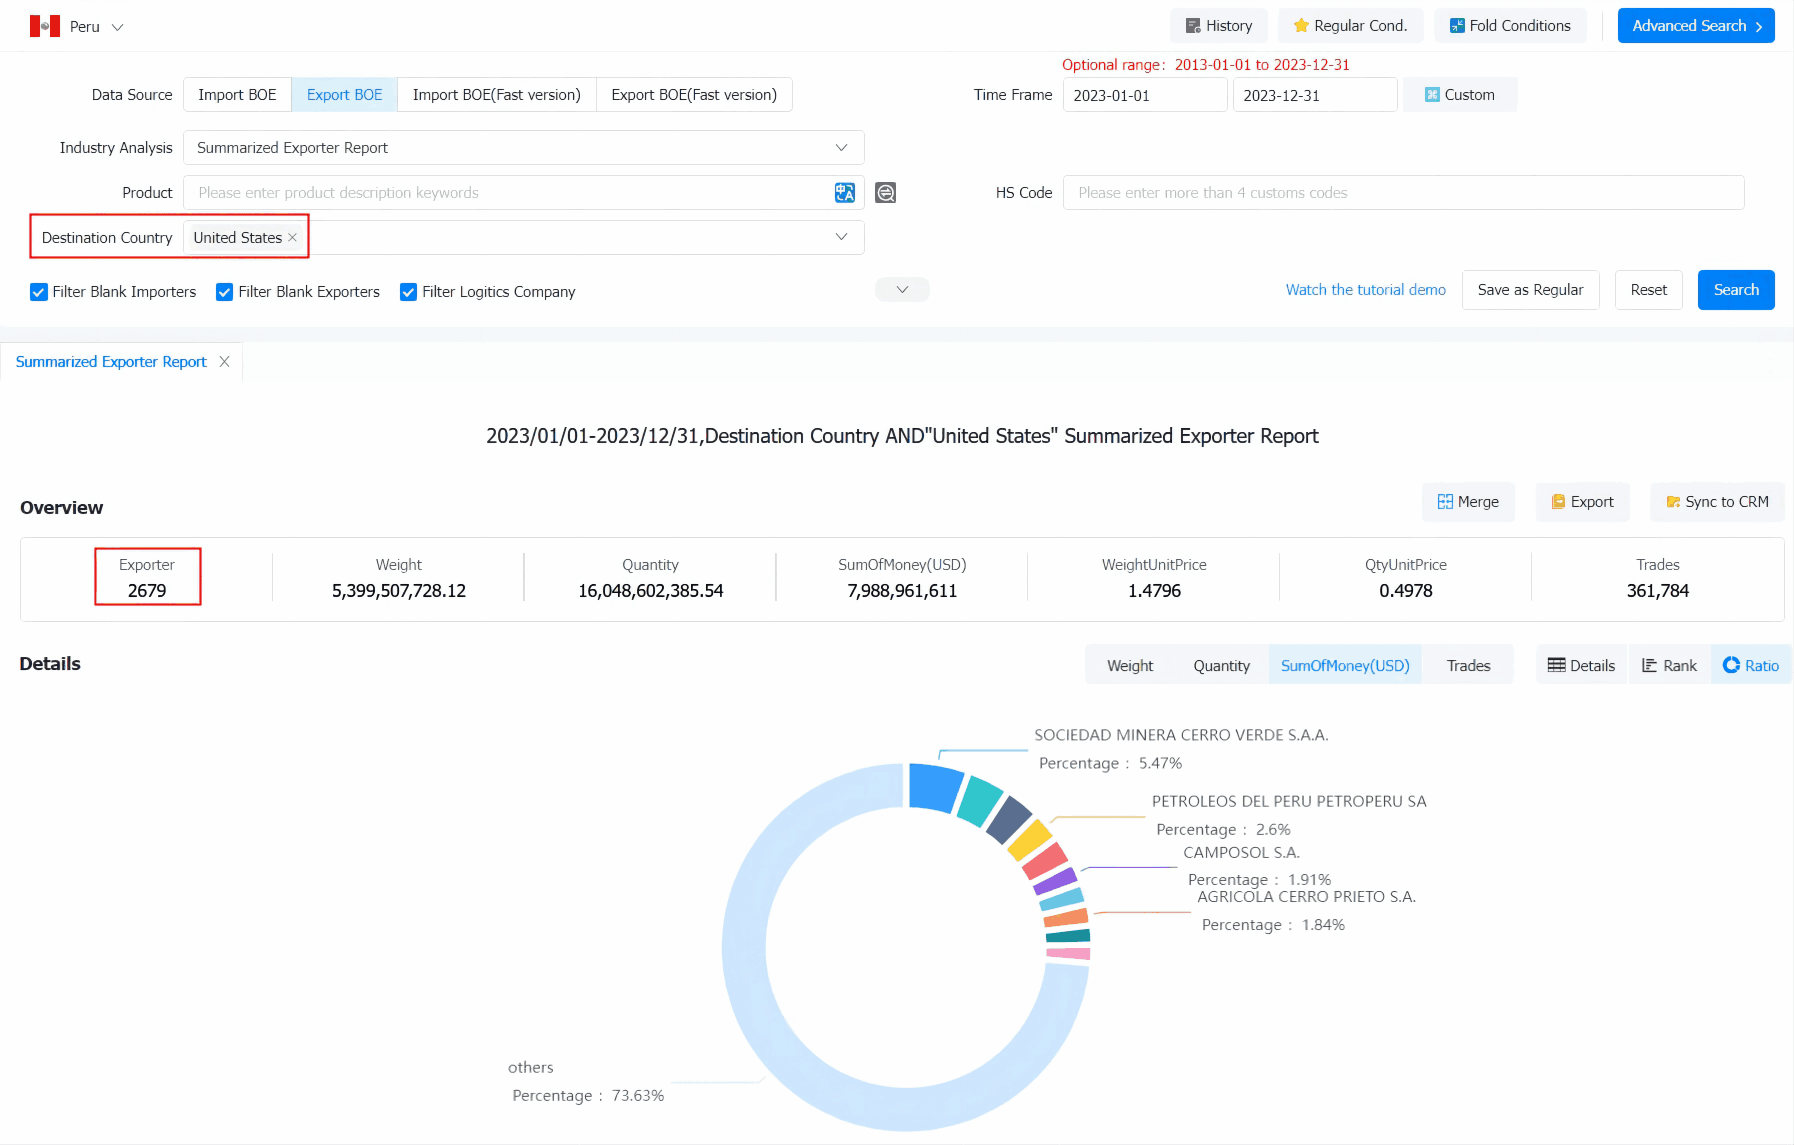
When you want to find out if your country cooperates with Peru, you can look up the latest Peru Exports Data in Tendata's import/export database by country name, and here's a sample of what you'll find (as of January 2024):

Category
Leave Message for Demo Request or Questions


 T-info
 T-discovery

 My
Tendata
 Market Analysis
 Customer
Development
 Competitor
Monitoring
 Customer Relationship


