 Trade Data
 25-01-2024
Rwanda's merchandise exports totaled $2.01 billion in 2022. Rwandan
merchandise exports are up 29% from $1.56 billion in 2021.
The latest Tendata iTrader data shows that the top 10 Rwandan exports based on the 2-digit HS code are:
· 71 (27.0%, 557 million):Natural or cultured pearls, precious or semi-precious stones, precious metals, metals clad with precious metal and articles thereof; imitation jewelry; coin
· 26 (12.5%, 252 million):Ores, slag and ash
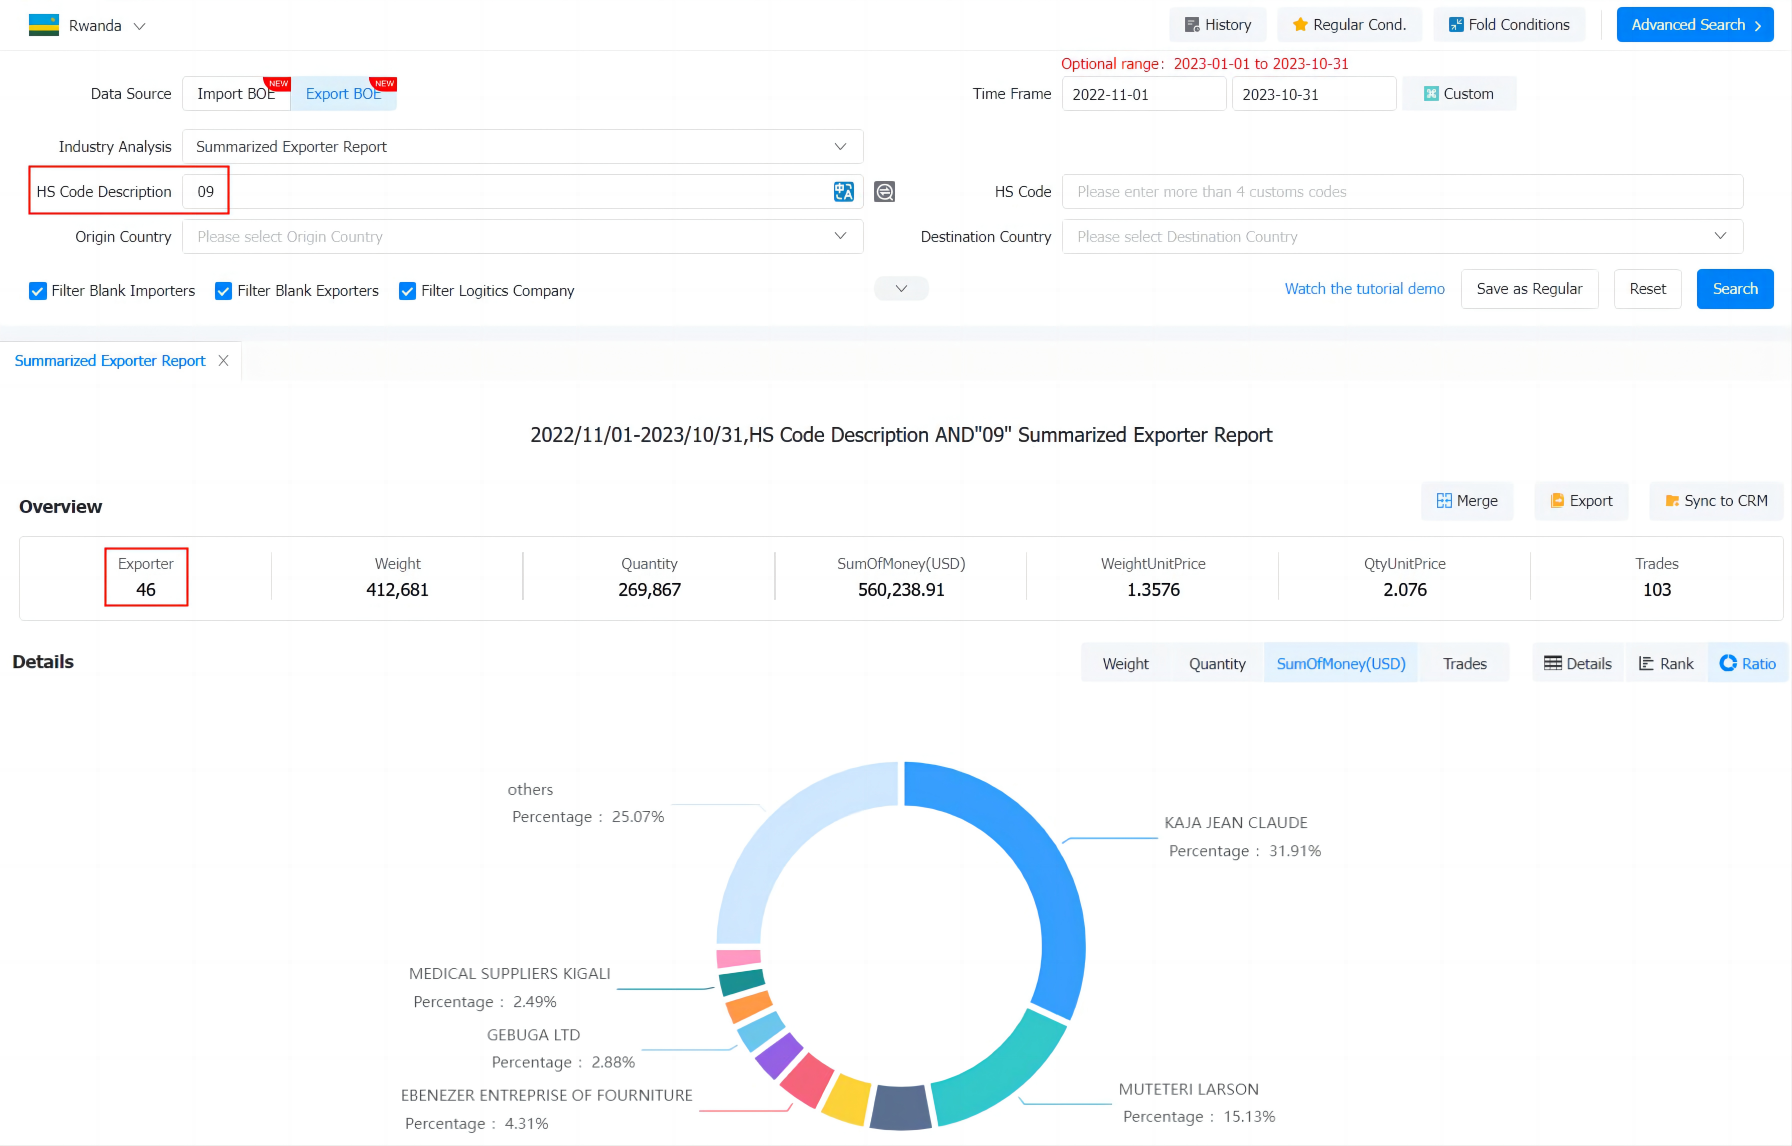
· 09 (10.0%, 202 million):Coffee, tea, matT and spices
· 27 (9.83%, 198 million):Mineral fuels, mineral oils and products of their distillation; bituminous substances; mineral waxes
· 19 (3.54%, 71 million):Preparations of cereals, flour, starch or milk; bakers' wares
· 15 (3.32%, 67 million):Animal, vegetable or microbial fats and oils and their cleavage products; prepared edible fats; animal or vegetable waxes
· 11 (3.23%, 65 million):Products of the milling industry; malt; starches; inulin; wheat gluten
· 10 (3.16%, 63 million):Cereals
· 25 (2.28%, 46 million):Salt; sulfur; earths and stone; plastering materials, lime and cement
· 17 (2.28%, 46 million):Sugars and sugar confectionery
When you need to conduct a market analysis of the Rwanda industry, you can find the latest Rwanda Exporters in Tendata's import/export database by product name or 2-digit HS code.The following is a sample of what we have found for you (data as of October 2023):

According to Tendata iTrader's more granular 4-digit HS codes, the top 10 Rwanda exports (sub-categories) are:
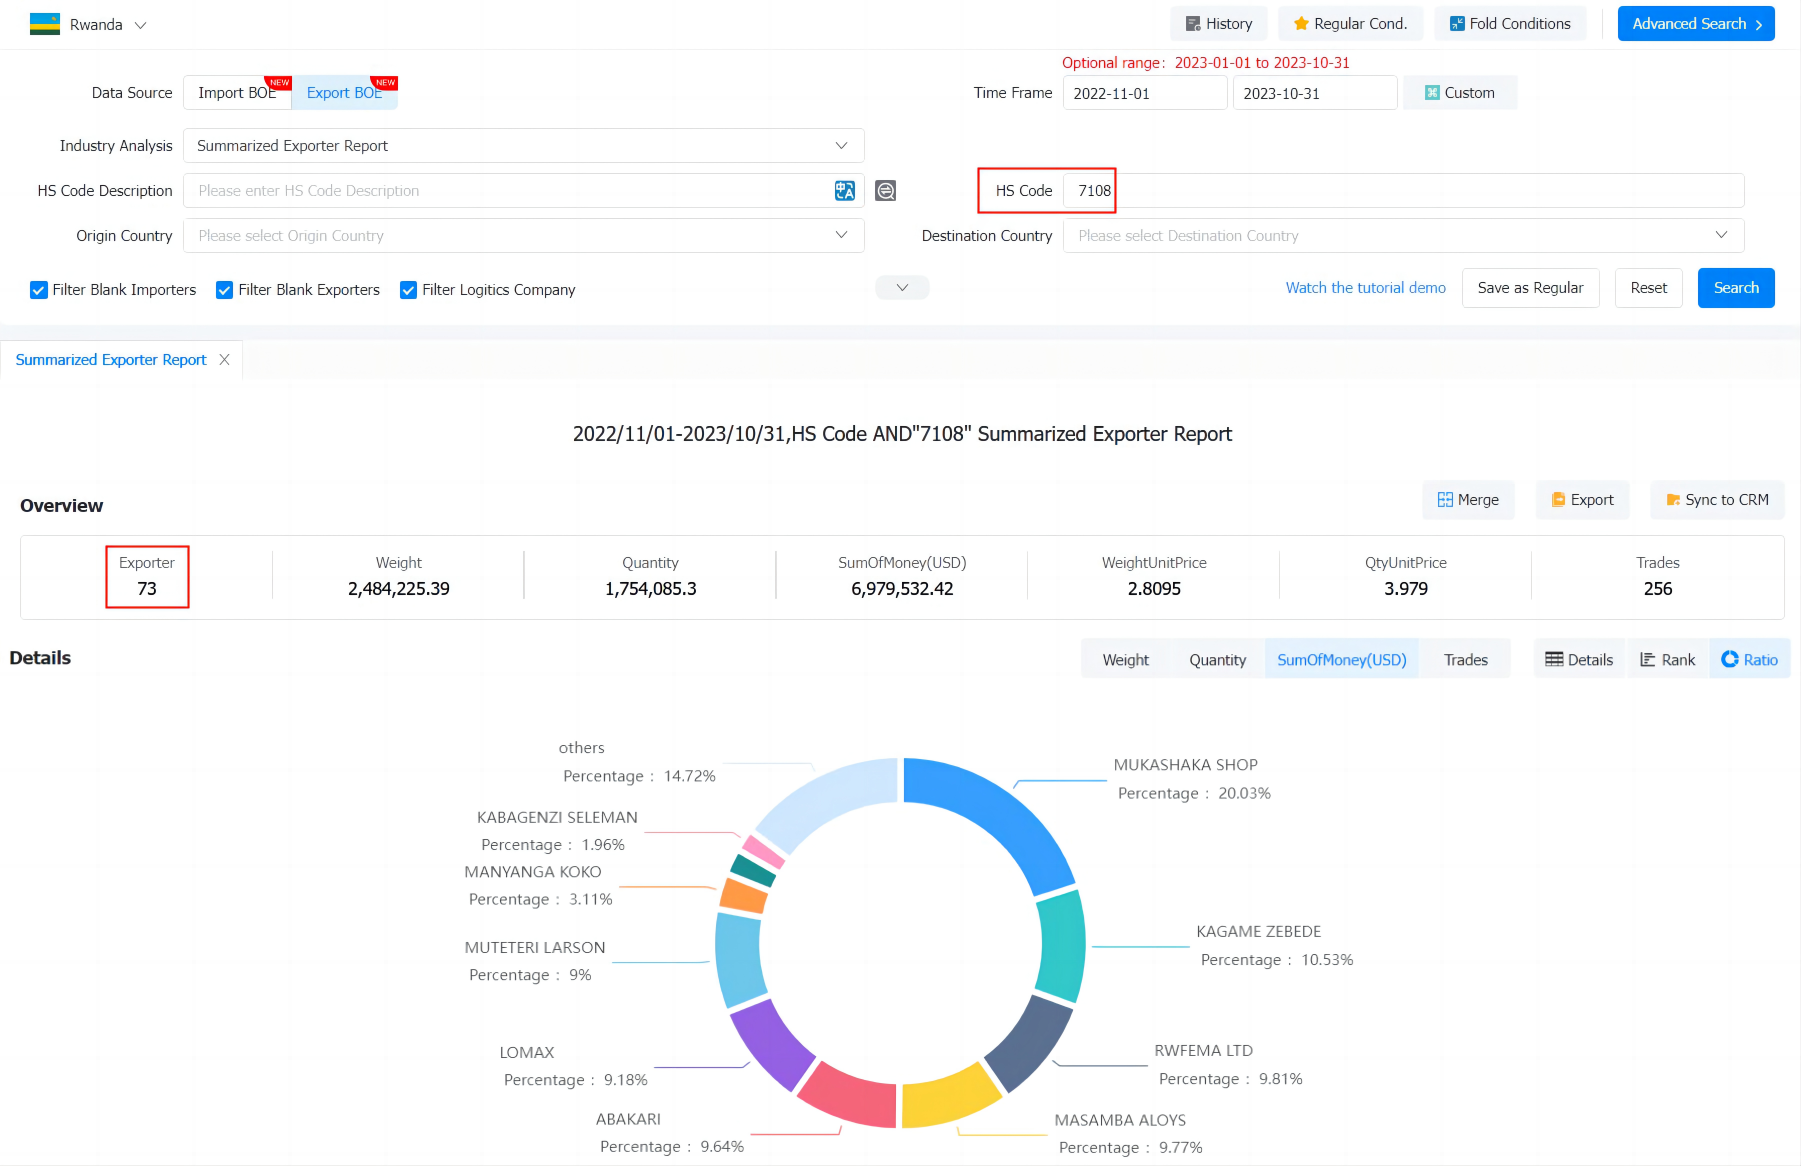
· 7108 (27.0%, $555 million):Gold (including gold plated with platinum) unwrought or in semi-manufactured forms, or in powder form
· 2710 (9.79%, $197 million):Petroleum oils and oils from bituminous minerals, not crude; preparations n.e.c. containing by weight 70% or more of petroleum oils or oils from bituminous minerals; these being the basic constituents of the preparations; waste oils
· 0902 (5.01%, $101 million):Tea, whether or not flavoured
· 0901 (4.75%, $96 million):Coffee, whether or not roasted or decaffeinated; coffee husks and skins; coffee substitutes containing coffee in any proportion
· 2617 (3.35%, $67 million):Ores and concentrates; n.e.s. in heading no. 2601
· 2609 (3.20%, $64 million):Tin ores and concentrates
· 2615 (3.15%, $63 million):Niobium, tantalum, vanadium or zirconium ores and concentrates
· 1006 (3.11%, $62 million):Rice
· 1511 (2.85%, $57 million):Palm oil and its fractions, whether or not refined, but not chemically modified
· 2611 (2.70%, $54 million):Tungsten ores and concentrates
When you need to check out potential Rwanda customers for your product, you can look up the latest Rwanda Exporters in Tendata's import/export database by following the 4-digit HS code.Below is a sample of what is available for you (data as of October 2023):

The latest Tendata iTrader data shows that Rwanda's main export partners are:
1. Congo (38%, 768 million US$)
2. United Arab Emirates (29%, 590 million US$)
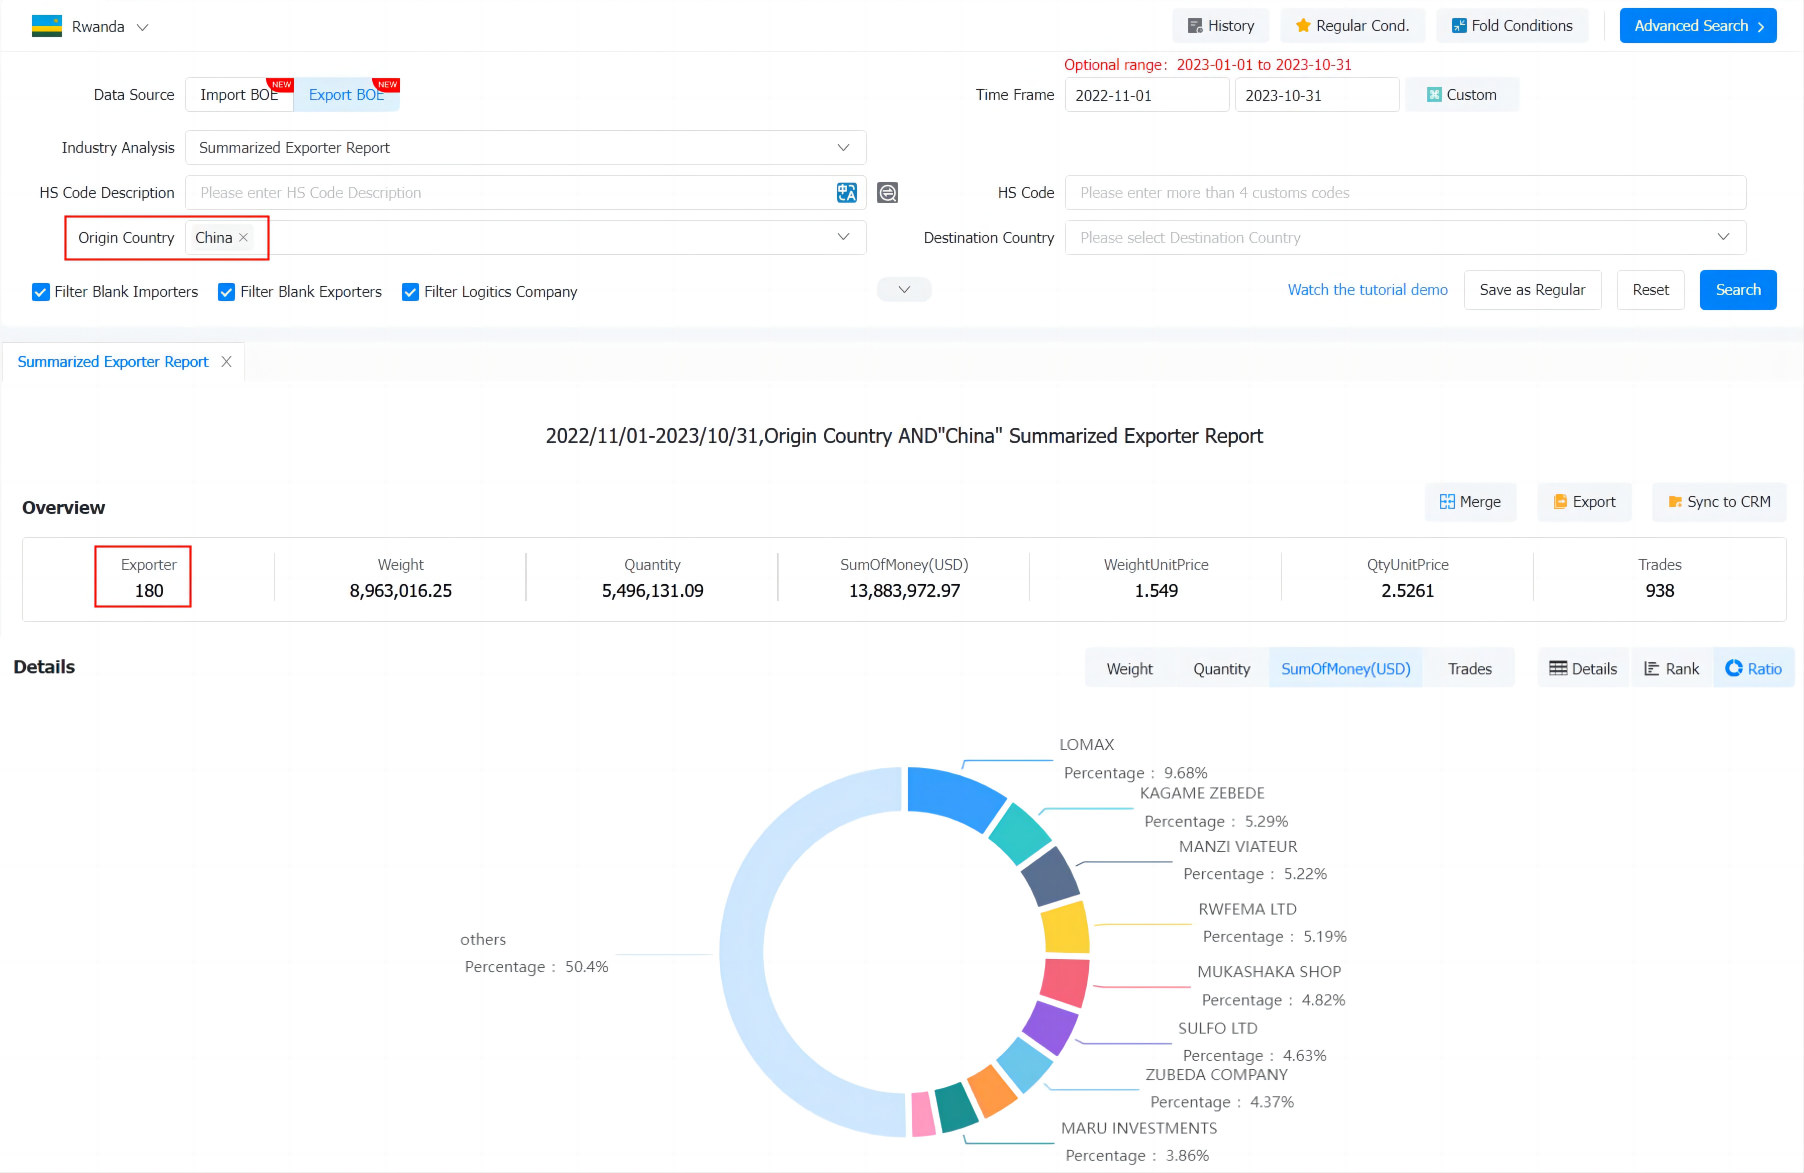
3. China (4.79%, 96 million US$)
4. India (3.52%, 71 million US$)
5. United Kingdom (2.3%, 46 million US$)
6. Hong Kong (1.95%, 39 million US$)
7. Pakistan (1.92%, 38 million US$)
8. Ethiopia (1.8%, 36 million US$)
9. Singapore (1.62%, 32 million US$)
10. USA (1.17%, 23 million US$)
When you want to find out if your country works with Rwanda, you can search Tendata's import/export database for the most recent Rwanda Exporters by country name.Here's a sample of what we've found for you (data as of October 2023):

Category
Leave Message for Demo Request or Questions


 T-info
 T-discovery

 My
Tendata
 Market Analysis
 Customer
Development
 Competitor
Monitoring
 Customer Relationship


