 Trade Data
 25-01-2024
In 2022, Rwanda's merchandise imports total $5.12 billion. This represents a 37% increase in Rwanda's merchandise imports compared to $3.73 billion in 2021.
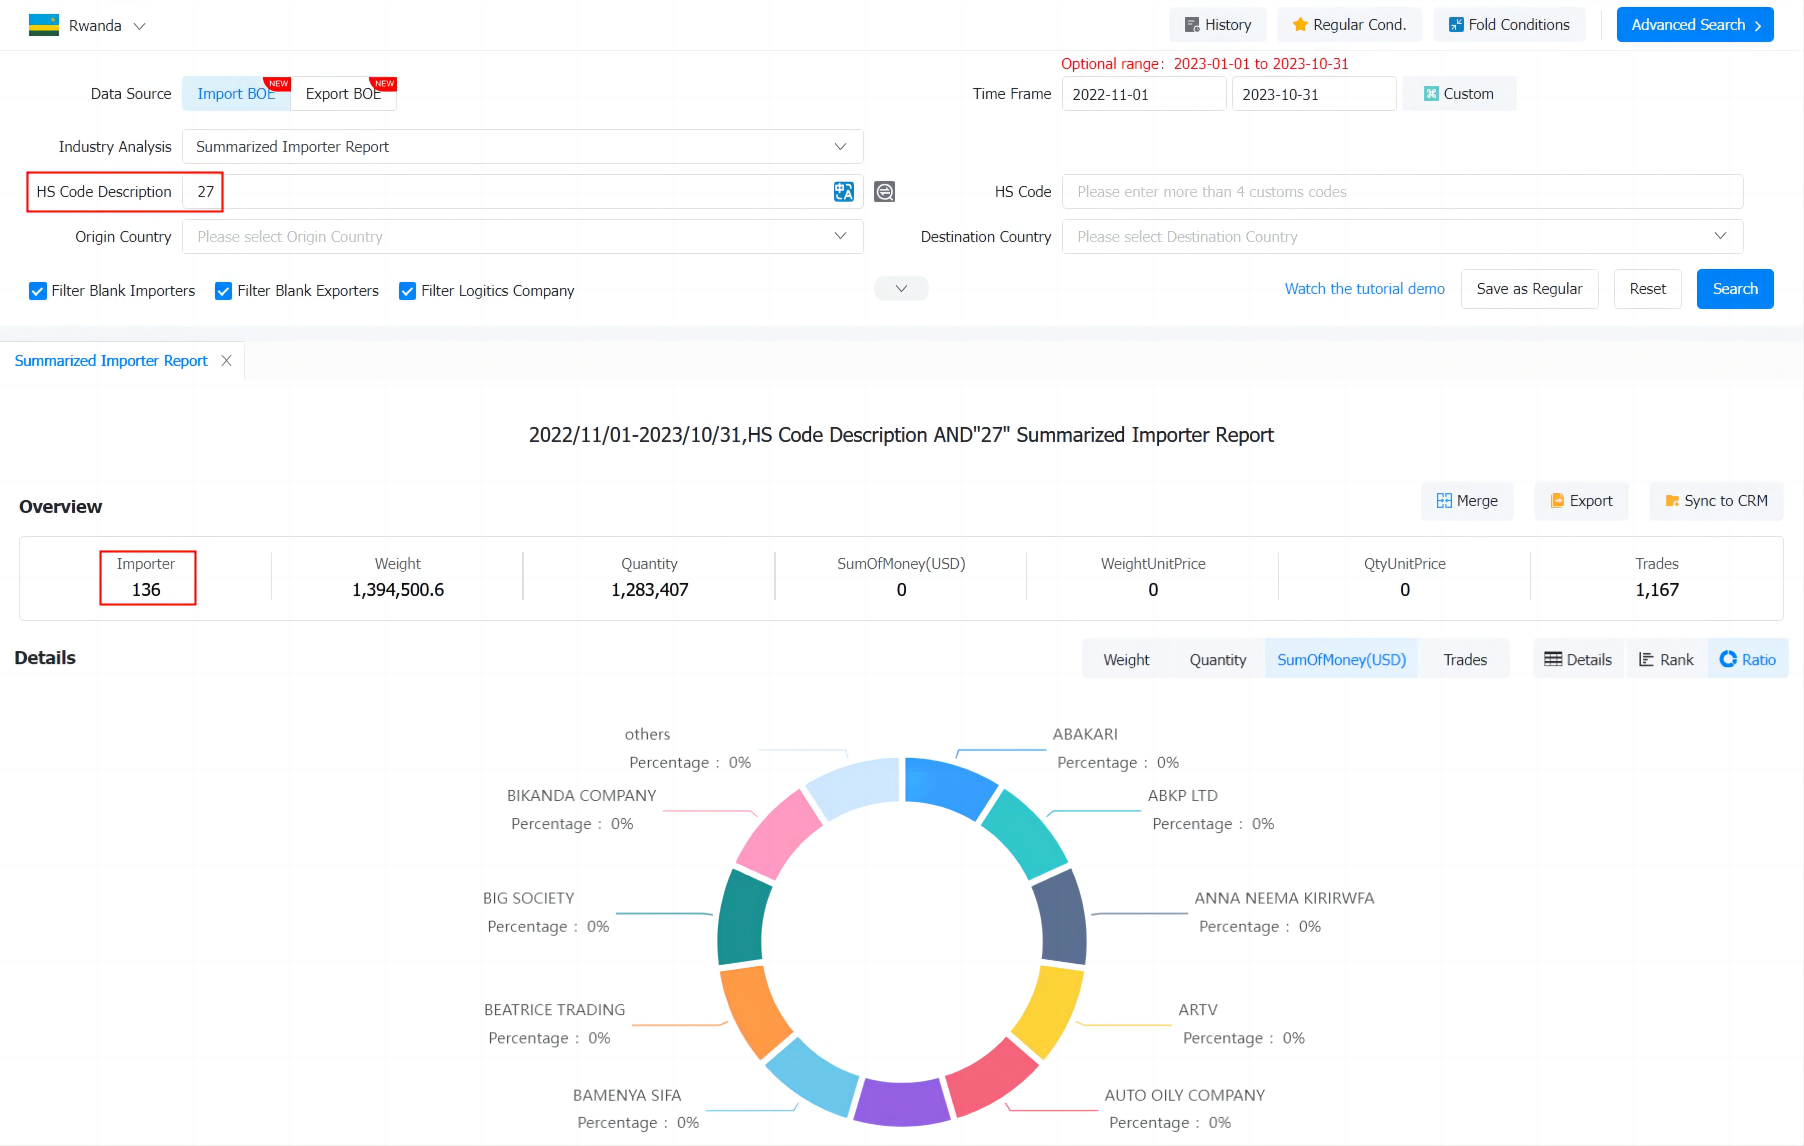
The latest Tendata iTrader data shows that the top 10 Rwandan imports based on the 2-digit HS code are:
· 27 (15.3%, 786 million):Mineral fuels, mineral oils and products of their distillation; bituminous substances; mineral waxes
· 71 (9.95%, 510 million):Natural or cultured pearls, precious or semi-precious stones, precious metals, metals clad with precious metal and articles thereof; imitation jewelry; coin
· 85 (6.28%, 321 million):Electrical machinery and equipment and parts thereof; sound recorders and reproducers, television image and sound recorders and reproducers, and parts and accessories of such articles
· 84 (6.01%, 308 million):Nuclear reactors, boilers, machinery and mechanical appliances; parts
· 10 (5.29%, 271 million):Cereals
· 15 (4.42%, 226 million):Animal, vegetable or microbial fats and oils and their cleavage products; prepared edible fats; animal or vegetable waxes
· 72 (3.90%, 199 million):Iron and steel
· 17 (3.80%, 194 million):Sugars and sugar confectionery
· 73 (3.30%, 169 million):Articles of iron or steel
· 87 (3.10%, 159 million):Vehicles other than railway or tramway rolling stock, and parts and accessories
When you need to conduct a market analysis of the Rwanda industry, you can find the latest Rwanda Importers in Tendata's import/export database by product name or 2-digit HS code.The following is a sample of what we have found for you (data as of October 2023):

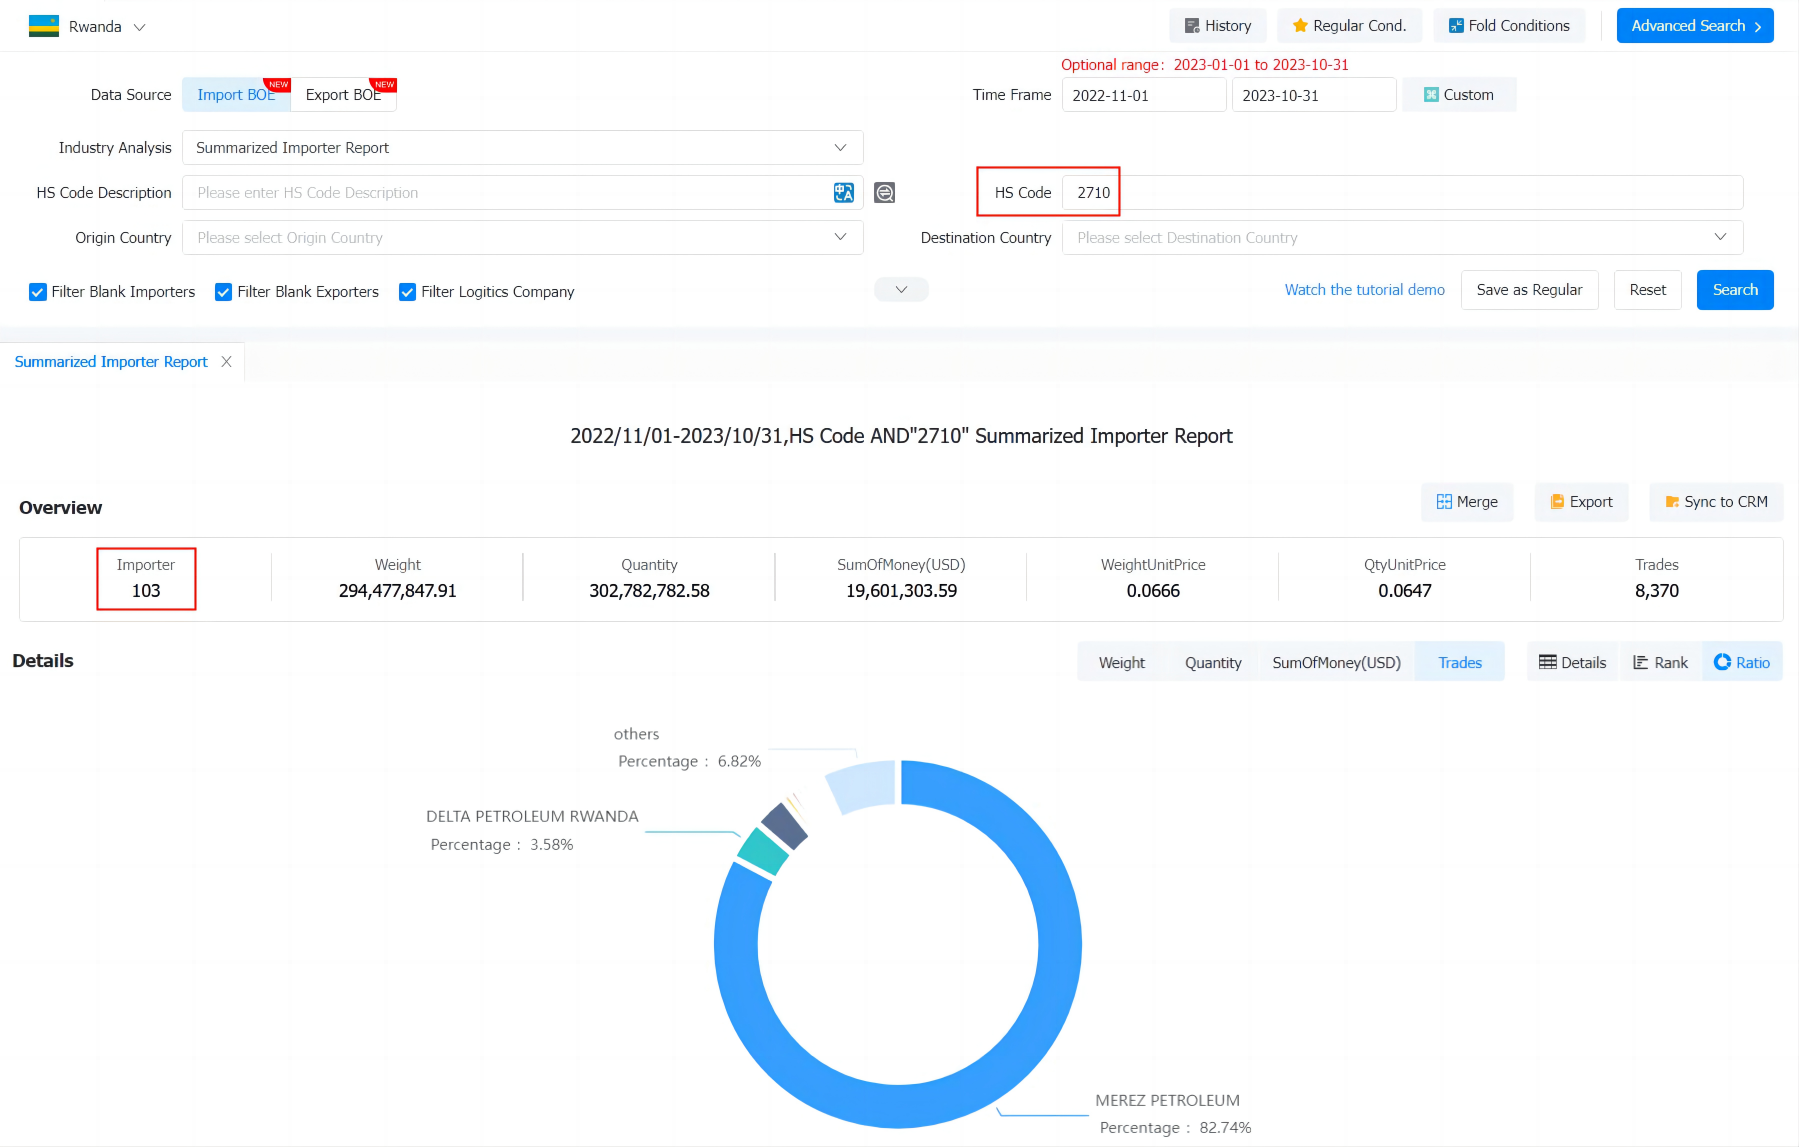
According to Tendata iTrader's more granular 4-digit HS codes, the top 10 Rwanda imports (subcategories) are:
· 2710 (14.0%, $718 million):Petroleum oils and oils from bituminous minerals, not crude; preparations n.e.c. containing by weight 70% or more of petroleum oils or oils from bituminous minerals; these being the basic constituents of the preparations; waste oils
· 7108 (9.95%, $509 million):Gold (including gold plated with platinum) unwrought or in semi-manufactured forms, or in powder form
· 1511 (3.41%, $174 million):Palm oil and its fractions, whether or not refined, but not chemically modified
· 1701 (3.39%, $174 million):Cane or beet sugar and chemically pure sucrose, in solid form
· 1006 (2.81%, $144 million):Rice
· 3105 (1.74%, $89 million):Mineral or chemical fertilisers containing two or three of the fertilising elements nitrogen, phosphorus and potassium; other fertilisers; goods of this Chapter in tablets or similar forms or in packages of a gross weight not exceeding 10 kg
· 8517 (1.67%, $85 million):Electrical apparatus for line telephony or line telegraphy, including line telephone sets with cordless handsets and telecommunication apparatus for carrier-current line systems or for digital line systems; videophones
· 3004 (1.59%, $81 million):Medicaments (excluding goods of heading 30.02, 30.05 or 30.06) consisting of mixed or unmixed products for therapeutic or prophylactic uses, put up in measured doses (including those in the form of transdermal administration systems) or in forms or packings for retail sale
· 1001 (1.54%, $79 million):Wheat and meslin
· 7210 (1.53%, $78 million):Flat-rolled products of iron or non-alloy steel, of a width of 600 mm or more, clad, plated or coated
When you need to look up potential Rwanda customers for your product, you can find the latest Rwanda Importers in Tendata's import/export database by following the 4-digit HS code.Here is a sample of what is available for you (data as of October 2023):

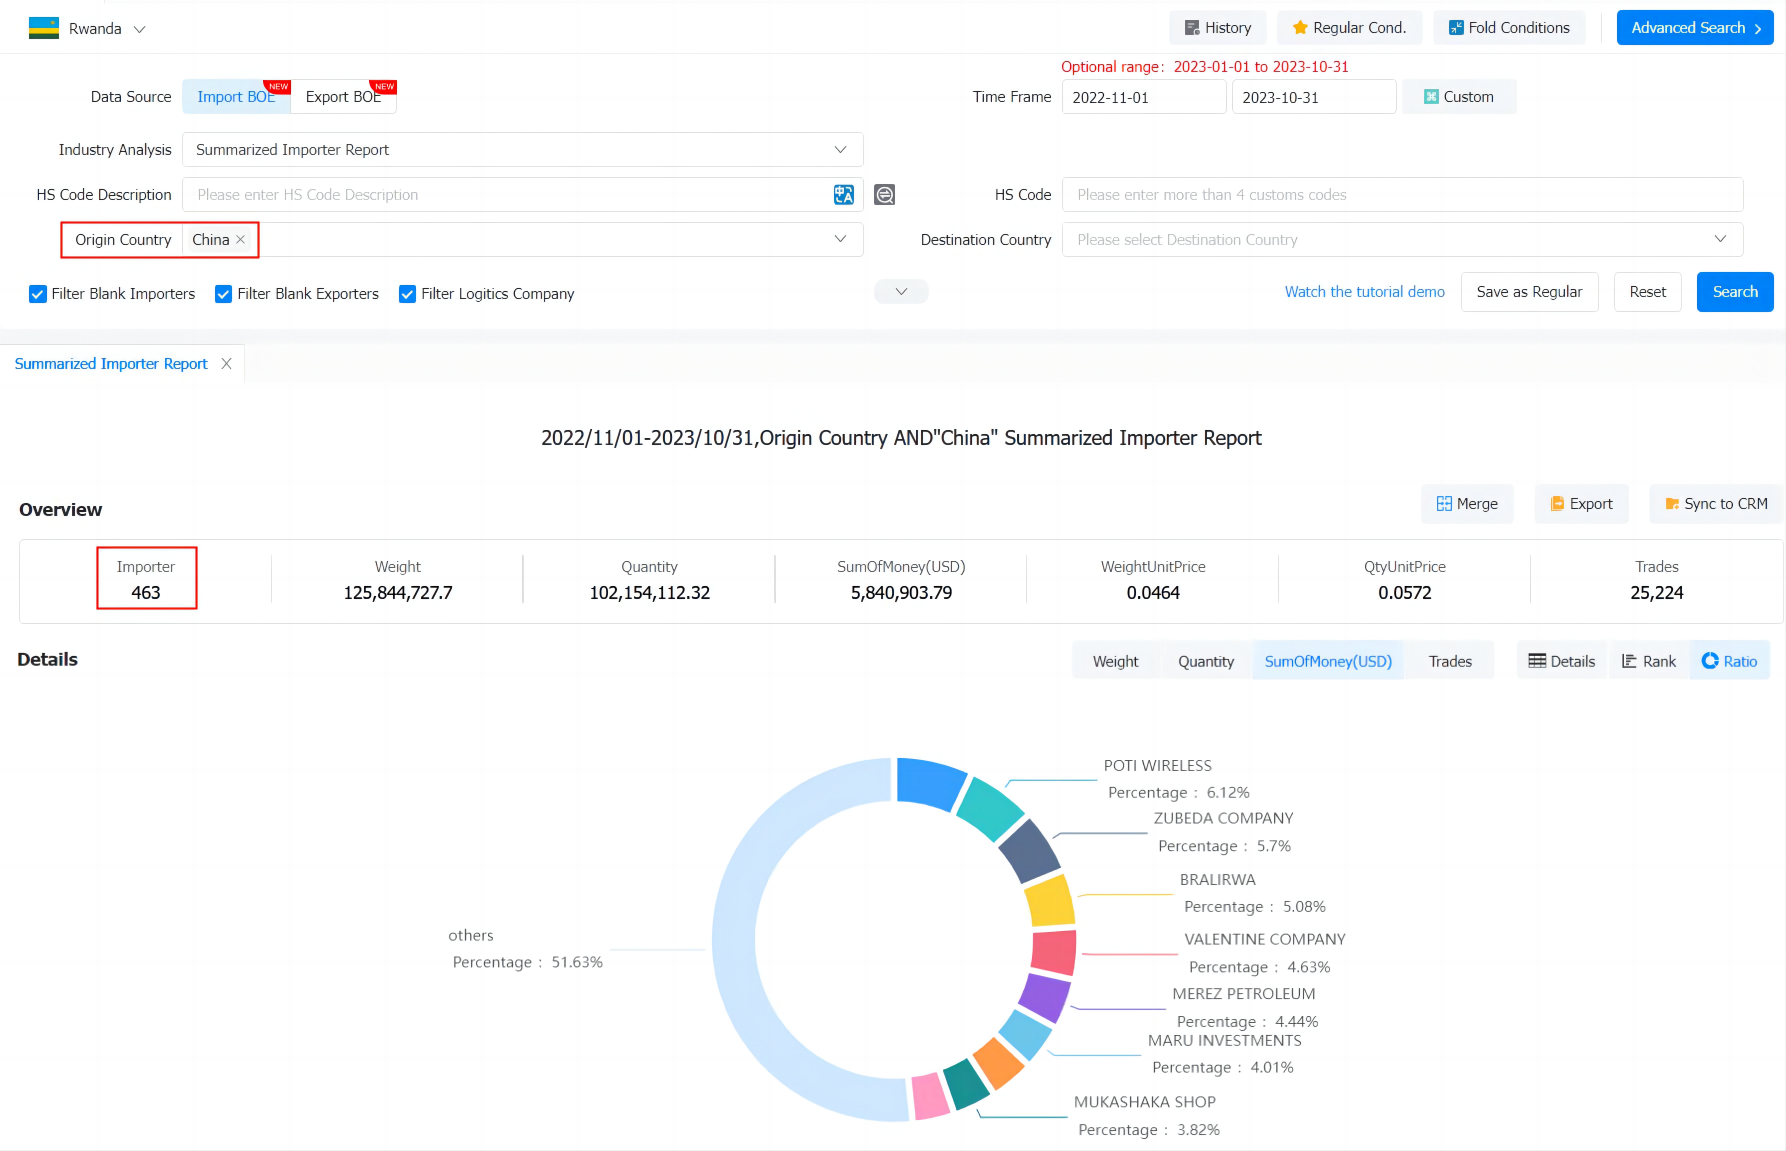
The latest Tendata iTrader data shows that Rwanda's main import partners are:
1. China (21%, 1.07 billion US$)
2. Tanzania (11%, 567 million US$)
3. Kenya (9.34%, 478 million US$)
4. India (9.27%, 475 million US$)
5. United Arab Emirates (8.17%, 419 million US$)
6. Saudi Arabia (3.15%, 161 million US$)
7. South Africa (2.55%, 130 million US$)
8. Belgium (2.45%, 125 million US$)
9. Indonesia (2.1%, 107 million US$)
10. Turkey (2.01%, 103 million US$)
When you want to find out if your country works with Rwanda, you can search Tendata's import/export database for the most recent Rwanda Importers by country name.Here's a sample of what's available to you (data as of October 2023):

Category
Leave Message for Demo Request or Questions


 T-info
 T-discovery

 My
Tendata
 Market Analysis
 Customer
Development
 Competitor
Monitoring
 Customer Relationship


