 Trade Data
 16-01-2024
Uruguay's merchandise exports totaled $11.1 billion in 2022. Uruguay's merchandise exports were valued at $9.54 billion, up 17.2% from 2021.
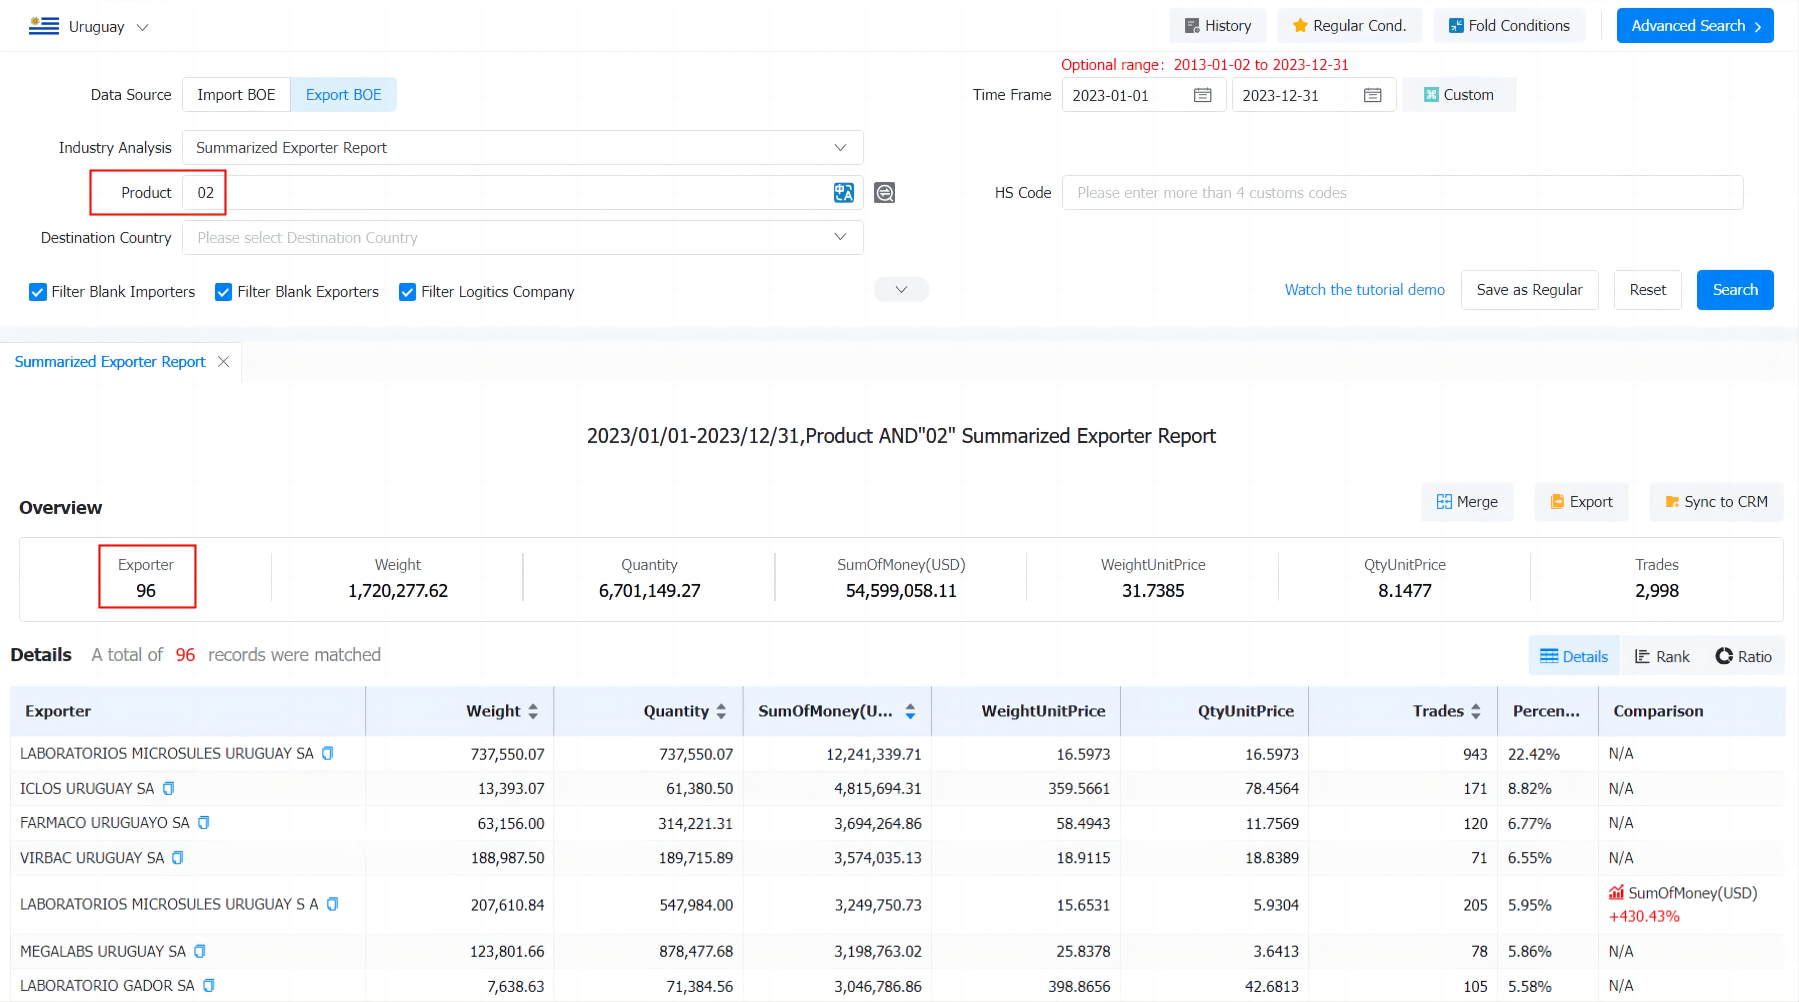
The latest Tendata iTrader data shows Uruguay's top 10 exports, based on the 2-digit HS code, are:
· 02 (25.0%, 2.89 billion):Meat and edible meat offal
· 12 (19.1%, 2.14 billion):Oil seeds and oleaginous fruits; miscellaneous grains, seeds and fruits; industrial or medicinal plants; straw and fodder
· 44 (9.68%, 1.08 billion):Wood and articles of wood; wood charcoal
· 04 (7.99%, 894 million):Dairy produce; birds eggs; natural honey; edible products of animal origin, not elsewhere specified
· 10 (7.31%, 819 million):Cereals
· 87 (3.91%, 437 million):Vehicles other than railway or tramway rolling stock, and parts and accessories
· 39 (3.15%, 352 million):Plastics and articles thereof
· 15 (2.62%, 293 million):Animal, vegetable or microbial fats and oils and their cleavage products; prepared edible fats; animal or vegetable waxes
· 11 (2.58%, 289 million):Products of the milling industry; malt; starches; inulin; wheat gluten
· 30 (1.64%, 184 million):Pharmaceutical products
When you need market analysis for the Uruguay industry, you can find the latest Uruguay Exports Data in Tendata's import/export database by product name or 2-digit HS code.The following is a sample of what is available for you (data as of December 2023):

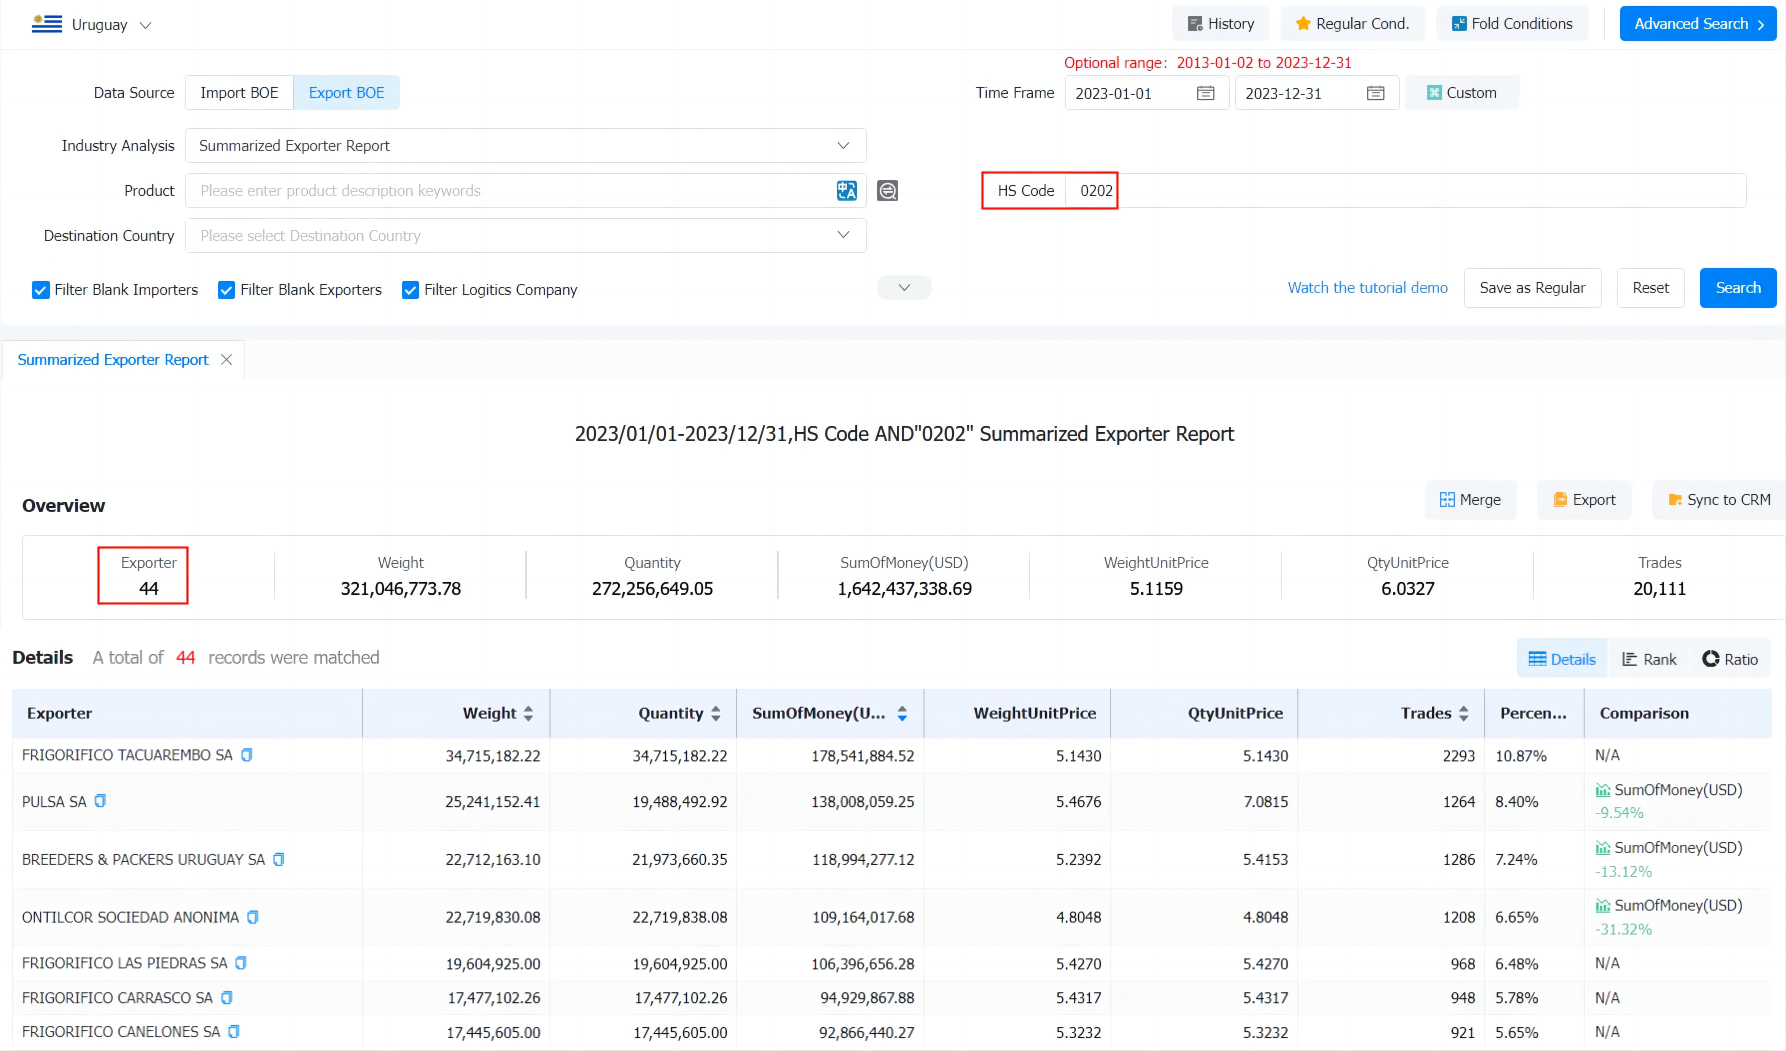
According to Tendata iTrader's more granular 4-digit HS codes, Uruguay's top 10 exports (sub-categories) are:
· 0202 (18.9%, $2.12 billion):Meat of bovine animals, frozen
· 1201 (17.1%, $1.92 billion):Soya beans, whether or not broken
· 4403 (6.02%, $673 million):Wood in the rough, whether or not stripped of bark or sapwood, or roughly squared
· 0402 (5.54%, $620 million):Milk and cream, concentrated or containing added sugar or other sweetening matter
· 1006 (4.45%, $498 million):Rice
· 0201 (3.85%, $430 million):Meat of bovine animals, fresh or chilled.
· 8704 (2.76%, $309 million):Motor vehicles for the transport of goods
· 1107 (2.54%, $284 million):Malt, whether or not roasted.
· 1001 (2.07%, $232 million):Wheat and meslin.
· 0206 (1.81%, $202 million):Edible offal of bovine animals, swine, sheep, goats, horses, asses, mules
When you need to check the Uruguay potential customers for your product, you can find the latest Uruguay Exports Data in Tendata's Import/Export database by following the 4-digit HS code.Below is a sample of what is available for you (data as of December 2023):

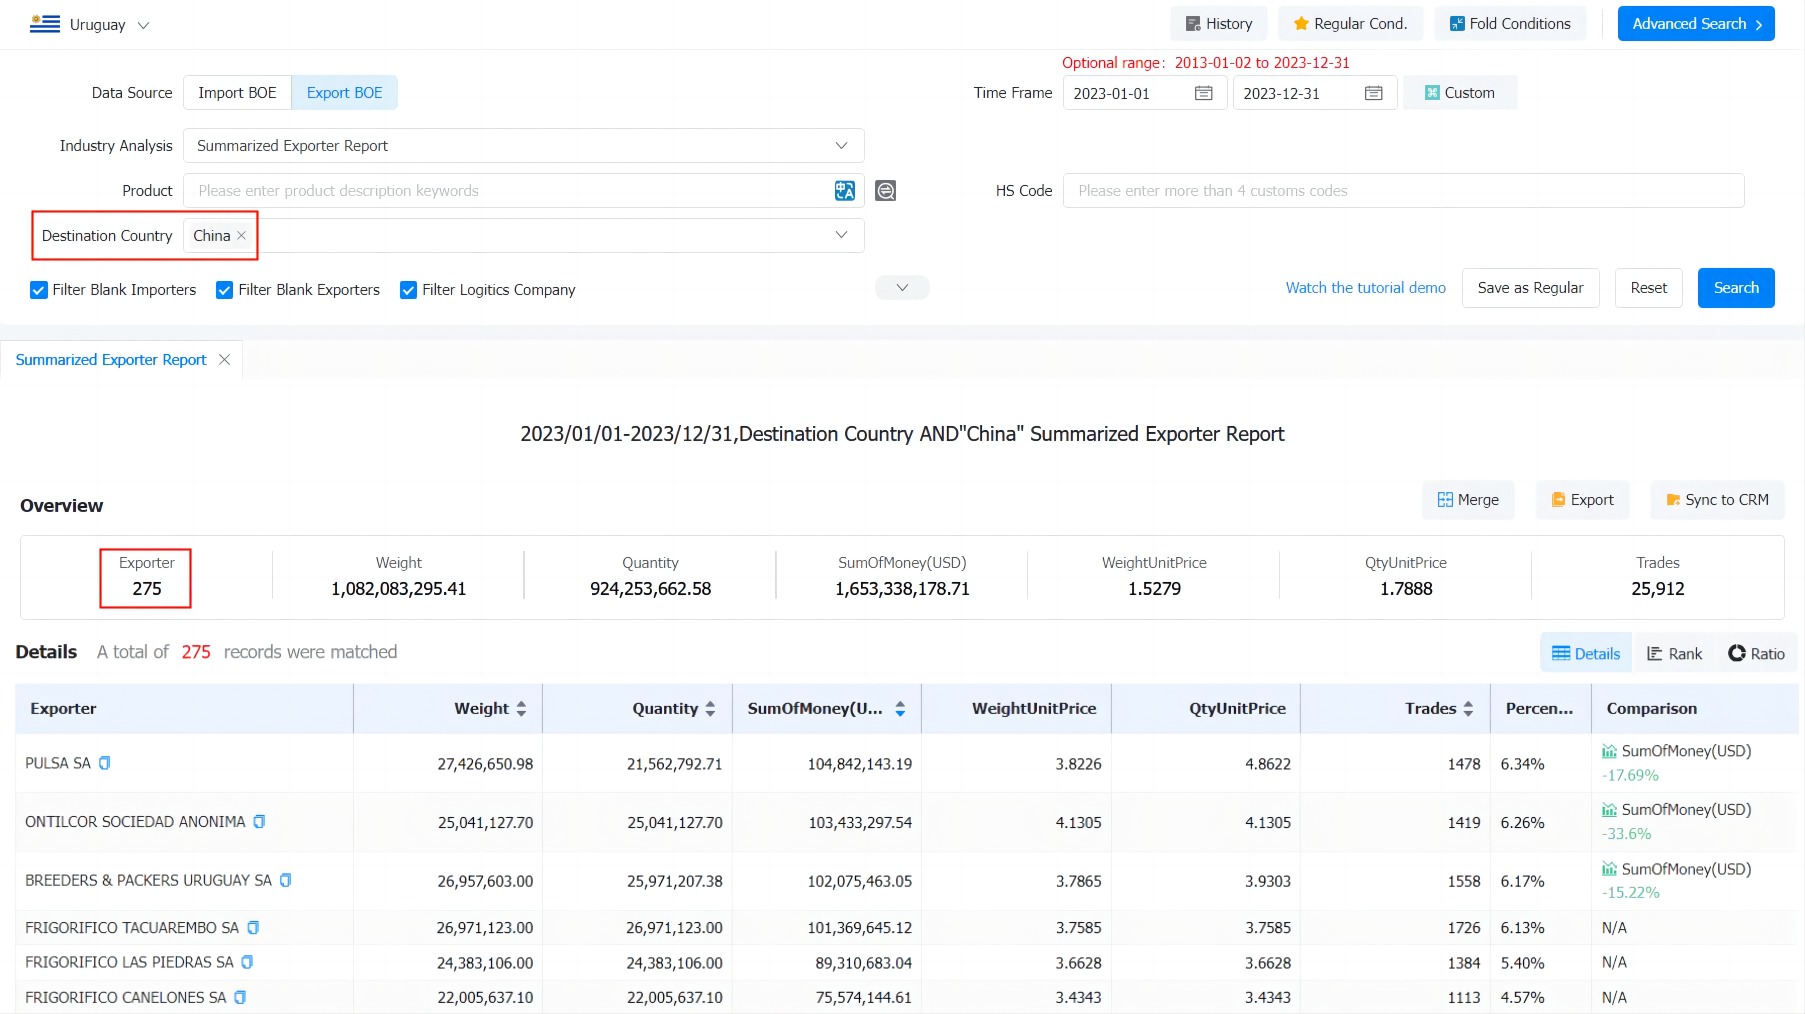
The latest Tendata iTrader data shows that Uruguay's main export partners are:
1. China (21%, 2.4 billion US$)
2. Free Zones (19%, 2.12 billion US$)
3. Brazil (14.9%, 1.67 billion US$)
4. Argentina (8.08%, 904 million US$)
5. USA (6.21%, 695 million US$)
6. Netherlands (2.62%, 294 million US$)
7. Algeria (2.04%, 228 million US$)
8. Mexico (1.82%, 203 million US$)
9. Chile (1.51%, 169 million US$)
10. Paraguay (1.29%, 144 million US$)
When you want to find out if your country cooperates with Uruguay, you can search Tendata's import/export database for the most recent Uruguay Exports Data by country, below is a sample of what is available to you (data as of December 2023):

Category
Leave Message for Demo Request or Questions


 T-info
 T-discovery

 My
Tendata
 Market Analysis
 Customer
Development
 Competitor
Monitoring
 Customer Relationship


