 Trade Data
 12-12-2023
Tanzania's merchandise exports totaled $6.82 billion in 2022. Tanzania
Merchandise Exports increased by 6.79% from $6.39 billion in 2021.
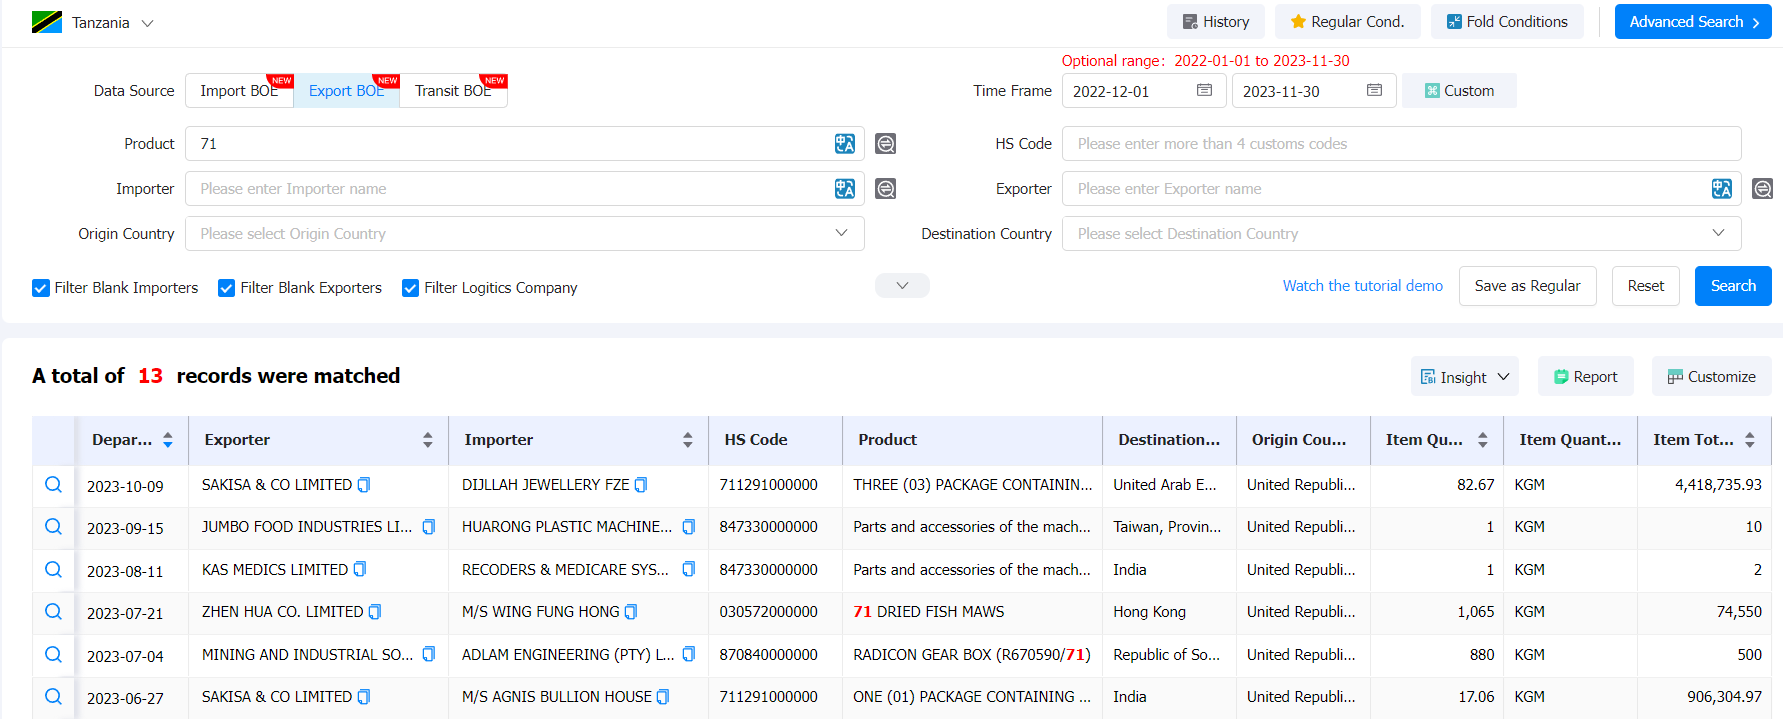
The latest Tendata iTrader data shows that Tanzania's top 10 exports based on the 2-digit HS code are:
· 71 (44.0%, 3.0 billion):Natural or cultured pearls, precious or semi-precious stones, precious metals, metals clad with precious metal and articles thereof; imitation jewelry; coin
· 10 (4.20%, 287 million):Cereals
· 09 (3.84%, 262 million):Coffee, tea, matT and spices
· 08 (3.79%, 258 million):Edible fruit and nuts; peel of citrus fruit or melons
· 27 (3.75%, 256 million):Mineral fuels, mineral oils and products of their distillation; bituminous substances; mineral waxes
· 12 (3.37%, 230 million):Oil seeds and oleaginous fruits; miscellaneous grains, seeds and fruits; industrial or medicinal plants; straw and fodder
· 26 (3.37%, 230 million):Ores, slag and ash
· 07 (3.12%, 213 million):Edible vegetables and certain roots and tubers
· 24 (3.12%, 213 million):Tobacco and manufactured tobacco substitutes
· 03 (2.46%, 168 million):Fish and crustaceans, molluscs and other aquatic invertebrates
When you need to conduct a market analysis for the Tanzania industry, you can find the latest Tanzania Exports Database in Tendata's Import/Export Database by product name or 2-digit HS code.The following is a sample of what is available to you (data as of November 2023):

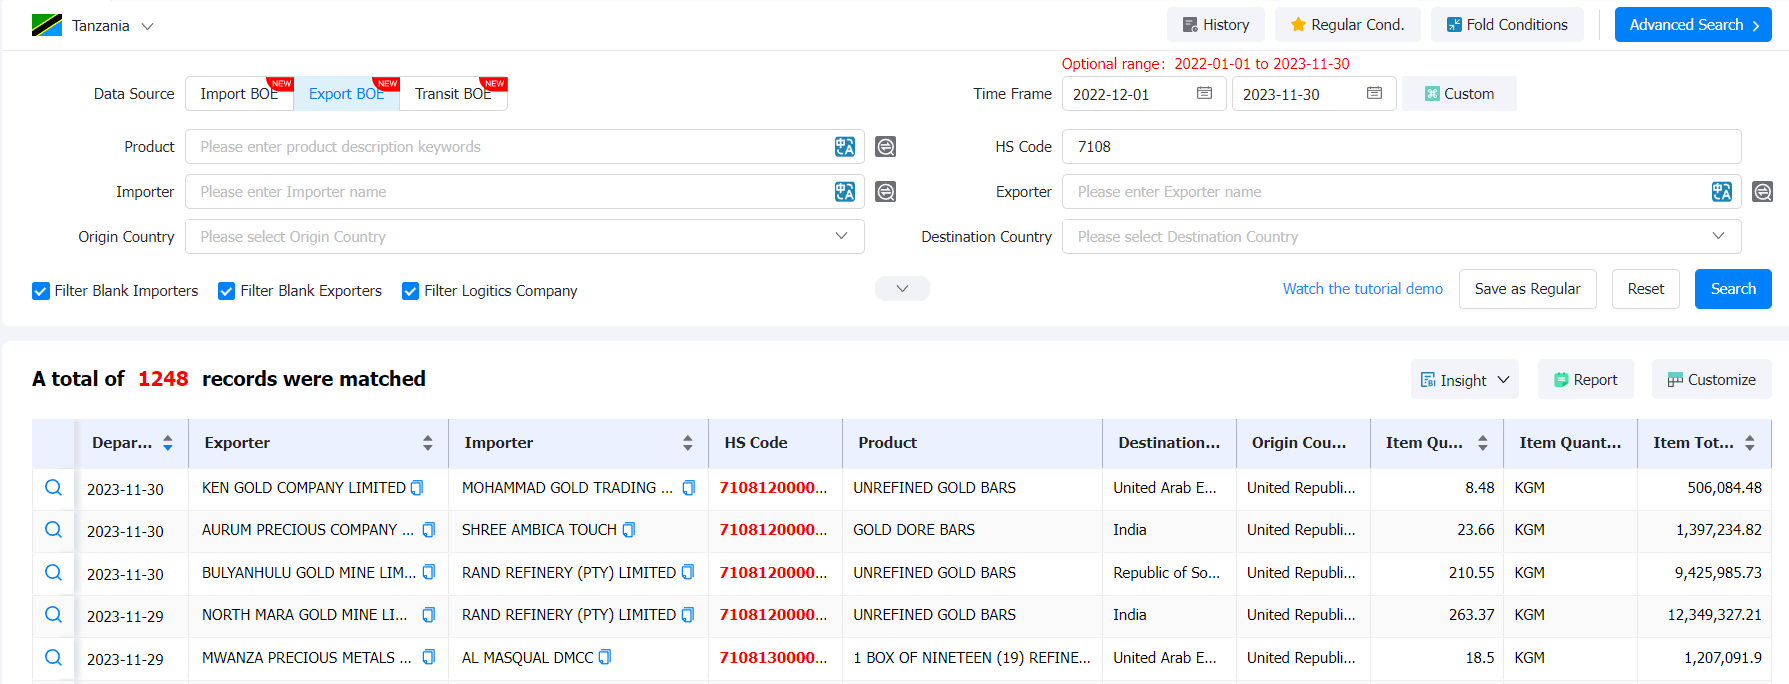
According to Tendata iTrader's more granular 4-digit HS code, Tanzania's top 10 exports (sub-categorized) are:
· 7108 (41.0%, $2.83 billion):Gold
· 0801 (3.44%, $234 billion):Coconuts, Brazil nuts and cashew nuts, fresh or dried
· 2603 (2.83%, $193 billion):Copper ores and concentrates
· 0713 (2.69%, $183 billion):Dried leguminous vegetables
· 1006 (2.68%, $183 billion):Rice
· 0901 (2.68%, $182 billion):Coffee
· 2401 (2.61%, $178 billion):Unmanufactured tobacco; tobacco refuse
· 2701 (2.34%, $160 billion):Coal; briquettes, ovoids and similar solid fuels manufactured from coal
· 1207 (2.17%, $148 billion):Other oil seeds and oleaginous fruits
· 1005 (1.30%, $88 billion):Maize (corn)
When you need to find potential Tanzania customers for a product, you can search Tendata's Import/Export Database for the latest Tanzania Exports Database by following the 4-digit HS Code. Below is a sample of what is available for you (data as of November 2023):

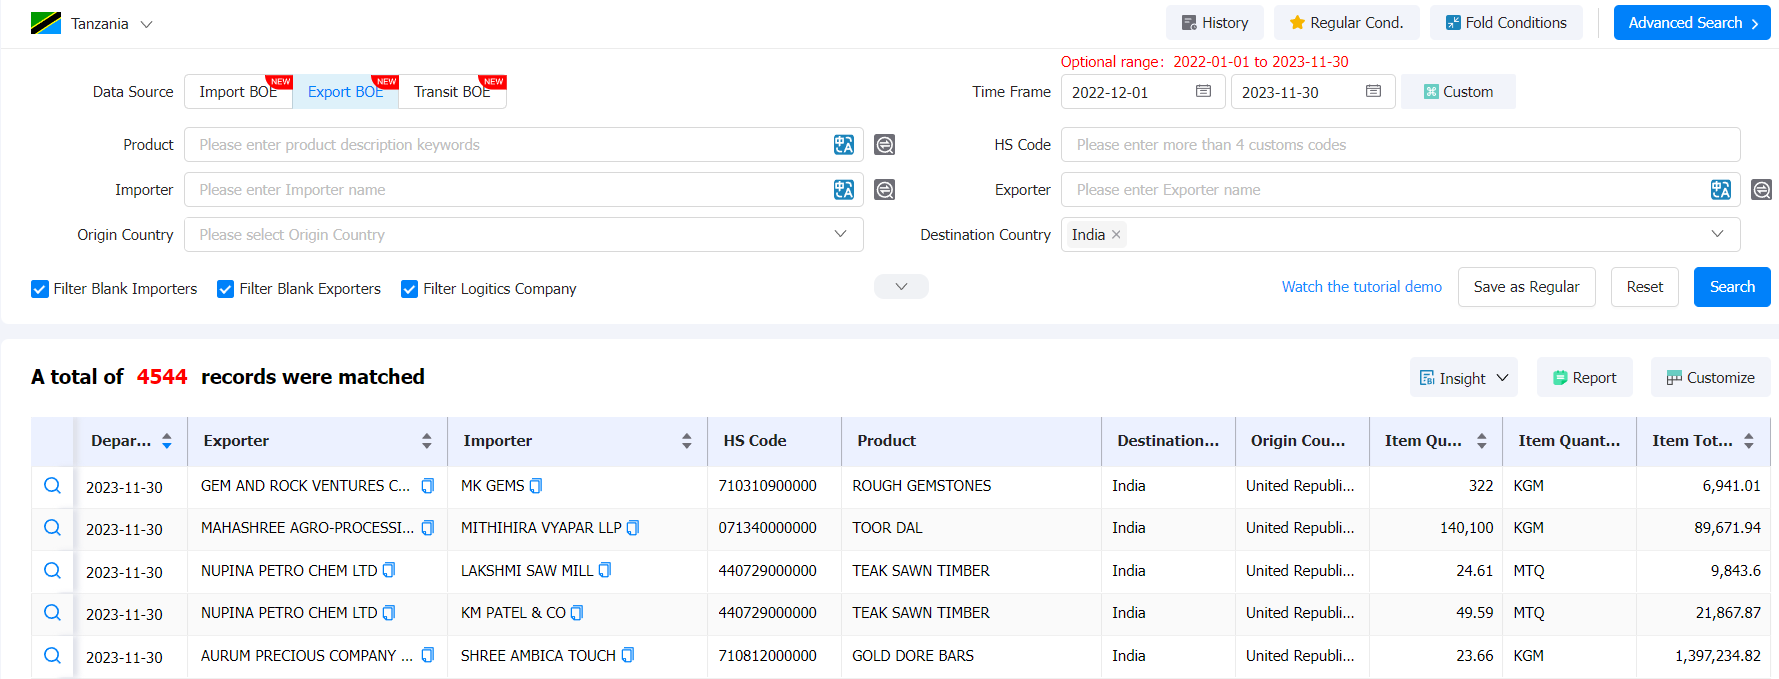
The latest Tendata iTrader data shows that Tanzania's main export partners are:
1. India (17.2%, 1.17 billion US$)
2. South Africa (13.6%, 929 million US$)
3. United Arab Emirates (11.1%, 762 million US$)
4. Kenya (5.59%, 381 million US$)
5. Switzerland (5.28%, 360 million US$)
6. China (4.3%, 293 million US$)
7. Congo (4.11%, 280 million US$)
8. Uganda (3.87%, 264 million US$)
9. Rwanda (3.84%, 262 million US$)
10. Burundi (3.11%, 212 million US$)
When you want to find out if your country cooperates with Tanzania, you can search Tendata's import/export database for the most recent Tanzania Exports Database by country name.The following is a sample of what is available to you (data as of November 2023):

Category
Leave Message for Demo Request or Questions


 T-info
 T-discovery

 My
Tendata
 Market Analysis
 Customer
Development
 Competitor
Monitoring
 Customer Relationship


