 Trade Data
 04-12-2023
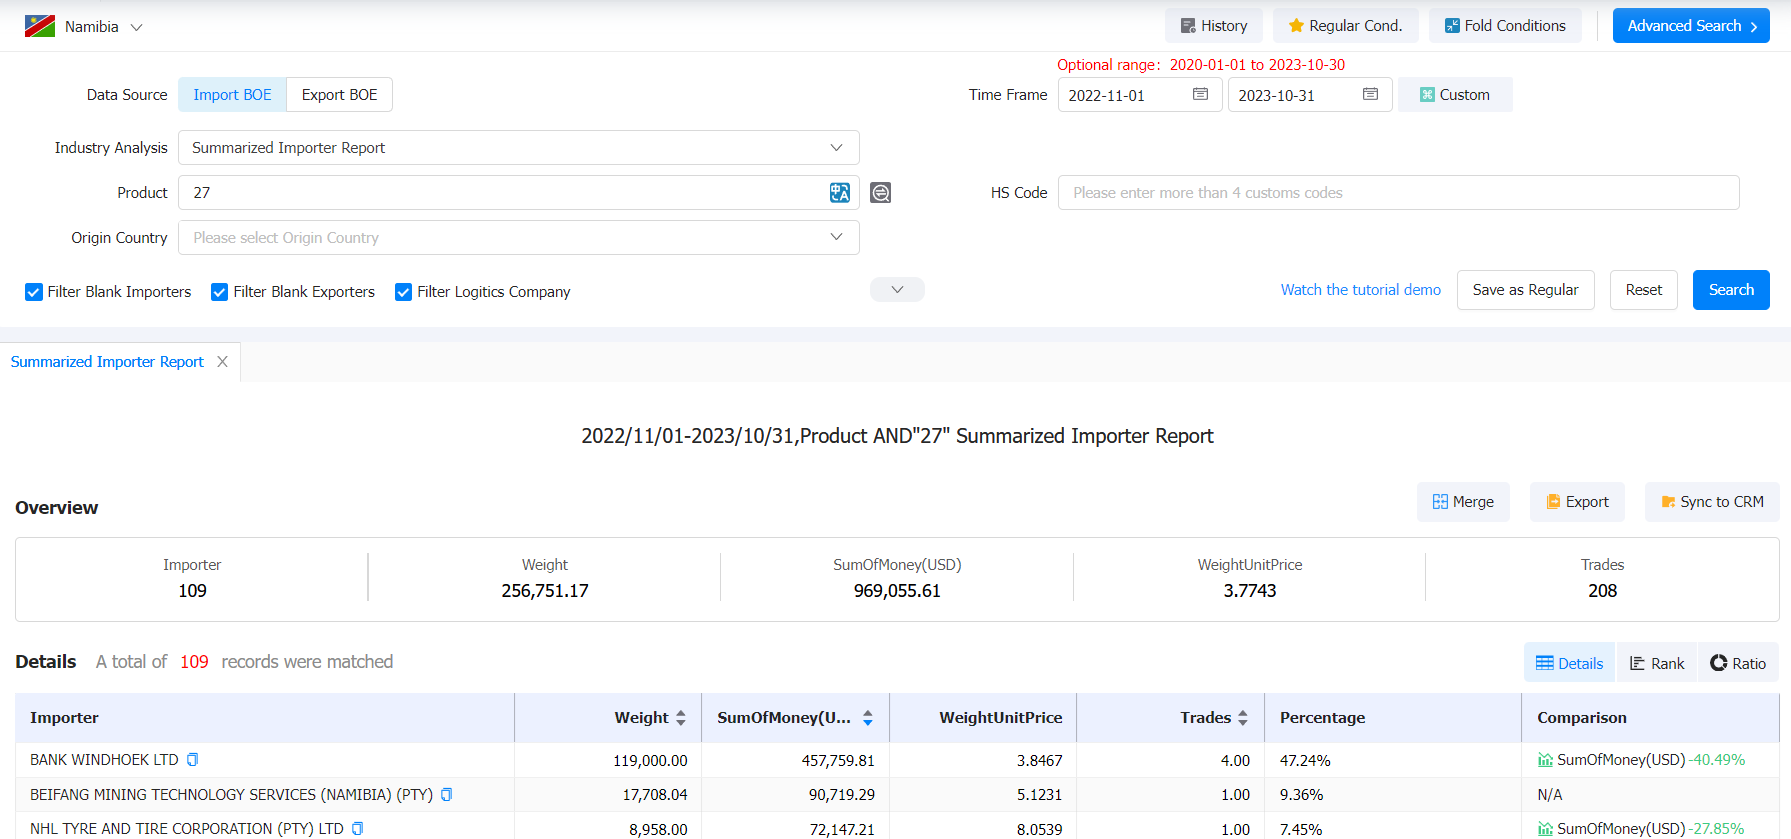
Namibia's merchandise imports in 2022 totaled $7.9 billion.
The latest Tendata iTrader data shows Namibia's top 10 imports, based on the 2-digit HS code, are:
· 27 (18.4%, 1.45 billion):Mineral fuels, mineral oils and products of their distillation; bituminous substances; mineral waxes
· 84 (8.59%, 679 billion):Nuclear reactors, boilers, machinery and mechanical appliances; parts
· 87 (7.44%, 588 billion):Vehicles other than railway or tramway rolling stock, and parts and accessories
· 26 (7.04%, 557 billion):Ores, slag and ash
· 85 (5.06%, 400 billion):Electrical machinery and equipment and parts
· 71 (3.39%, 268 billion):Natural or cultured pearls, precious or semi-precious stones, precious metals, metals clad with precious metal and articles thereof; imitation jewelry; coin
· 28 (2.86%, 226 billion):Inorganic chemicals; organic or inorganic compounds of precious metals, of rare earth metals, of radioactive elements or of isotopes
· 39 (2.83%, 224 billion):Plastics and articles
· 73 (2.65%, 209 billion):Articles of iron or steel
· 38 (2.17%, 172 billion):Miscellaneous chemical products
When you need to conduct a market analysis of the Namibia industry, you can search Tendata's Importers/Exporters Database for the most recent Namibia Importers Database by product name or 2-digit HS code.Below is a sample of what we have found for you (data as of October 2023):

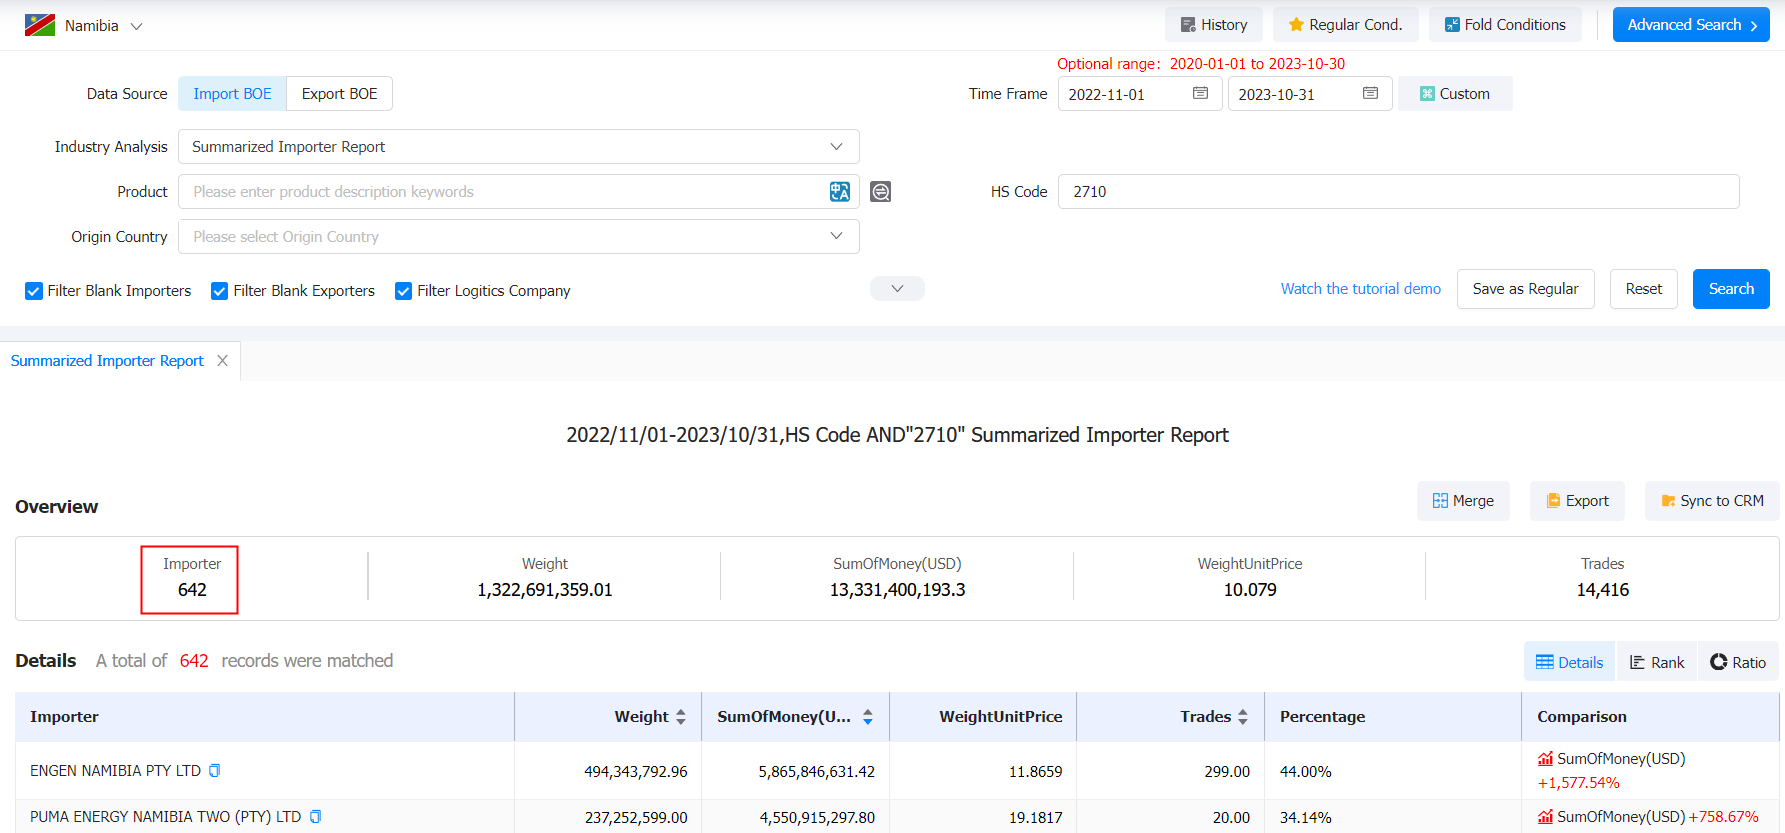
According to Tendata iTrader's more granular 4-digit HS codes, Namibia's top 10 imports (sub-categorized) are:
· 2710 (17.3%, $1.36 billion):Petroleum oils and oils from bituminous minerals, not crude; waste oils
· 2603 (4.52%, $357 billion):Copper ores and concentrates
· 7102 (3.34%, $264 billion):Diamonds
· 8704 (3.09%, $244 billion):Motor vehicles for the transport of goods
· 2616 (2.22%, $175 billion):Precious metal ores and concentrates
· 8908 (1.94%, $154 billion):Vessels and other floating structures for breaking up
· 8703 (1.88%, $148 billion):Motor cars and other motor vehicles principally designed for the transport of persons
· 3824 (1.55%, $122 billion):Prepared binders for foundry moulds or cores
· 2822 (1.49%, $118 billion):Cobalt oxides and hydroxides; commercial cobalt oxides
· 4011 (1.34%, $106 billion):New pneumatic tyres, of rubber
When you need to find potential Namibia customers for your product, you can look up the latest Namibia Importers Database in Tendata's import/export databases by following the 4-digit HS code.Below is a sample of what is available to you (data as of October 2023):

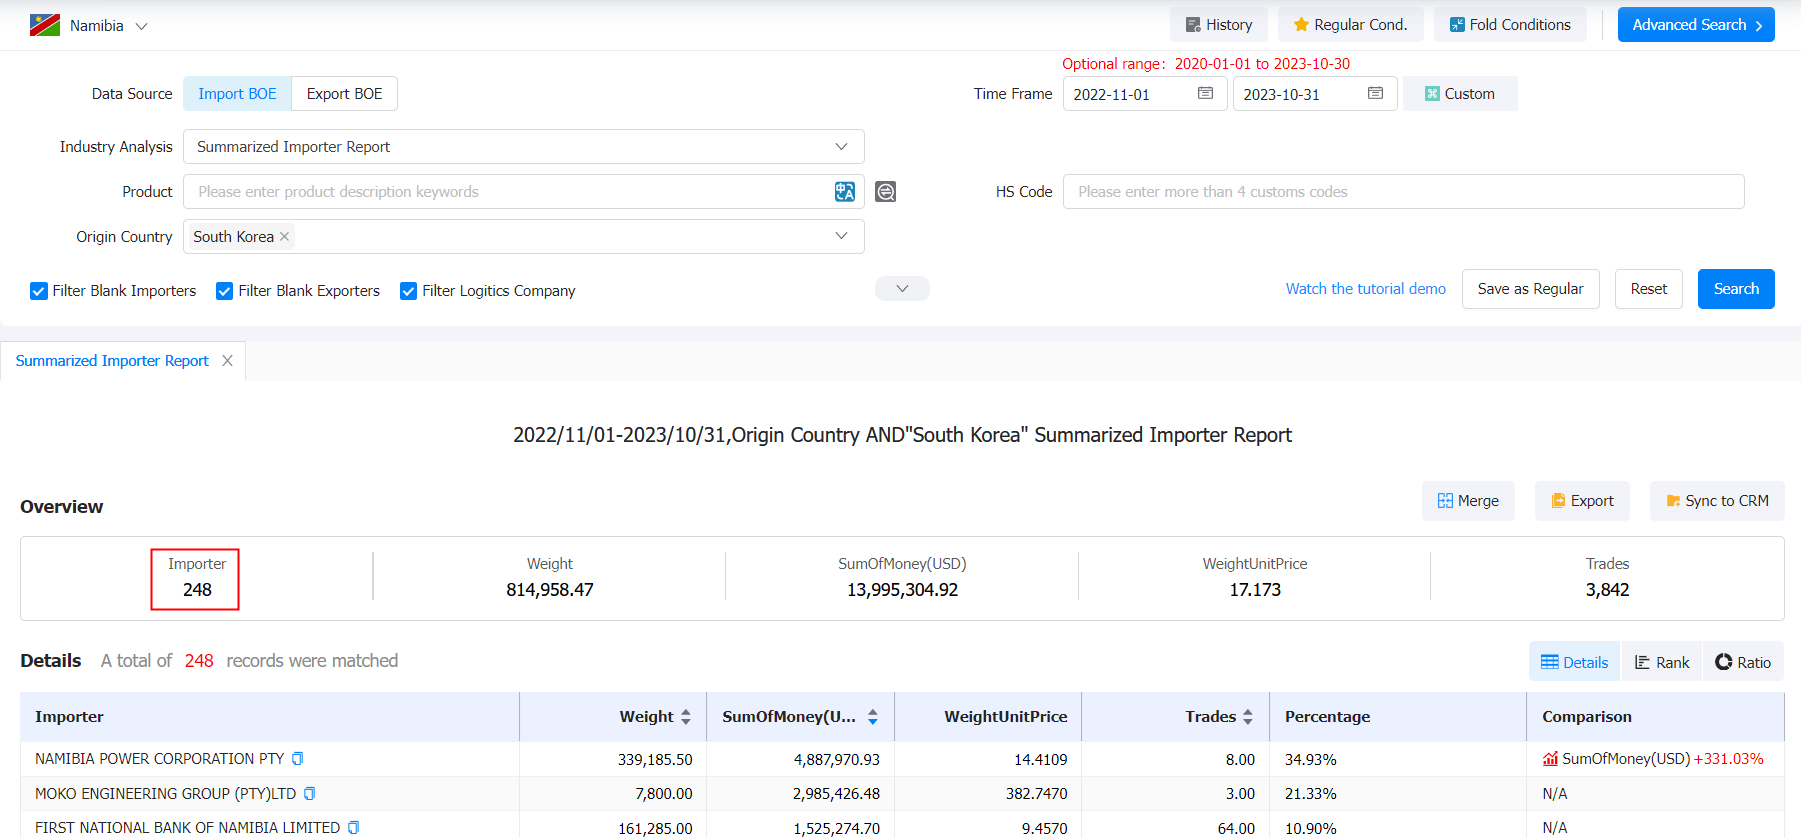
The latest Tendata iTrader data shows that Namibia's main import partners are:
1. South Africa (38%, 3.07 billion US$)
2. China (7.57%, 598 million US$)
3. Areas, nes (5.54%, 438 million US$)
4. India (4.66%, 368 million US$)
5. United Arab Emirates (3.82%, 302 million US$)
6. USA (3.33%, 263 million US$)
7. Peru (3.25%, 257 million US$)
8. Saudi Arabia (2.86%, 226 million US$)
9. Netherlands (2.83%, 223 million US$)
10. Bulgaria (2.46%, 194 million US$)
When you want to find out if your country works with Namibia, you can search Tendata's import/export databases for the most recent Namibia Importers Database by country name.The following is a sample of what is available to you (data as of October 2023)

Category
Leave Message for Demo Request or Questions


 T-info
 T-discovery

 My
Tendata
 Market Analysis
 Customer
Development
 Competitor
Monitoring
 Customer Relationship


