 Trade Data
 30-11-2023
Ethiopia's merchandise exports totaled $3.08 billion in 2022. Ethiopian Merchandise Exports increased by 0.898% from 3.05 billion in 2021.
The latest Tendata iTrader data shows that the top 10 exports of Ethiopia based on the 2-digit HS code are:
· 09 (49.0%, 1.52 billion):Coffee, tea, matT and spices
· 07 (17.1%, 529 billion):Edible vegetables and certain roots and tubers
· 12 (9.22%, 284 billion):Oil seeds and oleaginous fruits; miscellaneous grains, seeds and fruits; industrial or medicinal pla
· 06 (8.27%, 255 billion):Live trees and other plants; bulbs, roots and the like; cut flowers and ornamental foliage
· 02 (2.94%, 90 billion):Meat and edible meat offal
· 61 (2.44%, 75 billion):Articles of apparel and clothing accessories, knitted or crocheted
· 62 (1.61%, 49 billion):Articles of apparel and clothing accessories, not knitted or crocheted
· 01 (0.87%, 27 billion): Live animals
· 41 (0.78%, 24 billion): Raw hides and skins (other than fur skins) and leather
· 70 (0.58%, 17.9 billion):Glass and glassware
When you need to conduct a market analysis of the Ethiopia industry, you can find the latest Ethiopia Trade Data in Tendata's import/export databases by product name or 2-digit HS code.Below is a sample of the data (data as of October 2023) that was searched for you:

According to Tendata iTrader's more granular 4-digit HS codes, Ethiopia's top 10 exports (sub-categorized) are:
· 0901 (49.0%, $1.51 billion):Coffee, whether or not roasted or decaffeinated; coffee husks and skins
· 0709 (7.53%, $232 billion):Other vegetables, fresh or chilled
· 0603 (7.44%, $229 billion):Cut flowers and flower buds of a kind suitable for bouquets or for ornamental purposes, fresh, dried, dyed, bleached, impregnated or otherwise prepared
· 1207 (6.77%, $209 billion):Other oil seeds and oleaginous fruits, whether or not broken, n.e.s. in chapter 12
· 0713 (5.64%, $174 billion):Dried leguminous vegetables, shelled, whether or not skinned or split
· 0204 (2.86%, $88 billion):Meat of sheep or goats, fresh, chilled or frozen.
· 0714 (1.86%, $57 billion):Manioc, arrowroot, salep, Jerusalem artichokes, sweet potatoes and similar roots and tubers with high starch or inulin content; sago pith.
· 1201 (1.44%, $44 billion):Soya beans
· 6203 (0.94%, $29 billion):Men's or boys' suits, ensembles, jackets, blazers, trousers, bib and brace overalls, breeches and shorts (other than swimwear).
· 0712 (0.91%, $28 billion):Dried vegetables, whole, cut, sliced, broken or in powder
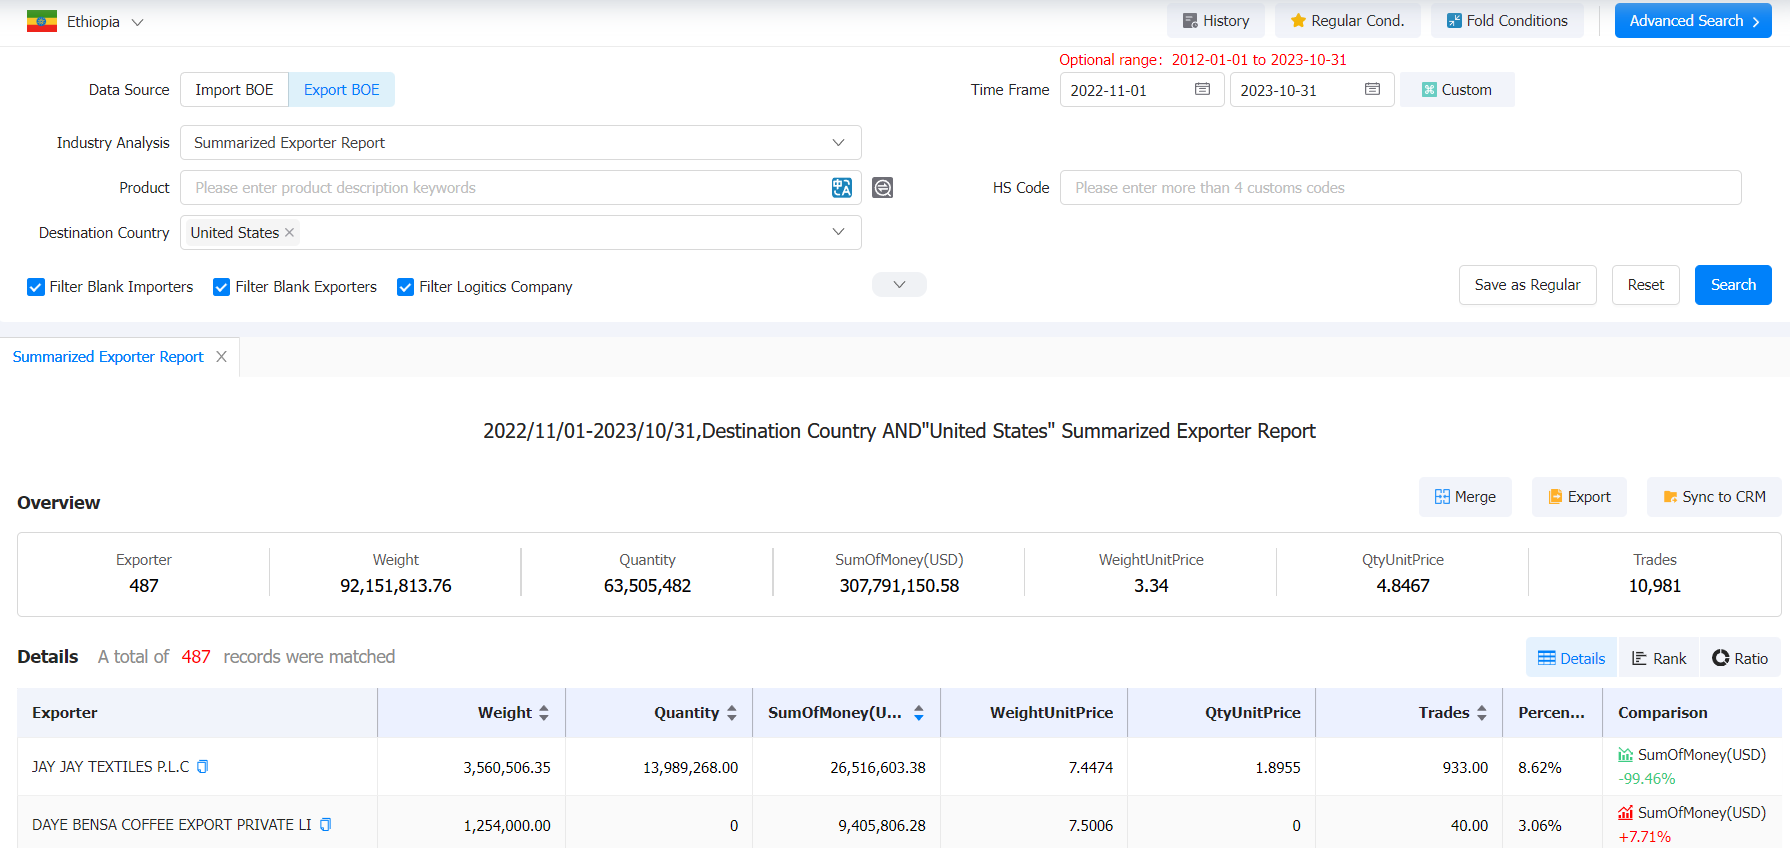
When you need to look up potential Ethiopia customers for your product, you can find the latest Ethiopia Trade Data in Tendata's import/export database by following the 4-digit HS code.Here's a sample of what's available for you (data as of Oct. 2023):

The latest Tendata iTrader data shows that Ethiopia's main export partners are:
1. USA (10.8%, 334 million US$)
2. Saudi Arabia (8.68%, 268 million US$)
3. Somalia (8.58%, 264 million US$)
4. Germany (8.36%, 257 million US$)
5. Netherlands (7.03%, 217 million US$)
6. United Arab Emirates (6.66%, 205 million US$)
7. Belgium (4.47%, 138 million US$)
8. Japan (4.31%, 133 million US$)
9. China (4.21%, 129 million US$)
10. Korea (3.88%, 119 million US$)
When you want to find out if your country cooperates with Ethiopia, you can search Tendata's import/export database for the most recent Ethiopia Trade Data by country name.The following is a sample of what is available to you (data as of October 2023):

Category
Leave Message for Demo Request or Questions


 T-info
 T-discovery

 My
Tendata
 Market Analysis
 Customer
Development
 Competitor
Monitoring
 Customer Relationship


