 Trade Data
 30-11-2023
In 2022, Ethiopia merchandise imports totaled $16.5 billion. Compared to $15.2 billion in 2021, Ethiopia Merchandise Imports increased by 8.19%.
The latest Tendata iTrader data shows that based on the 2-digit HS code, the top 10 imports of Ethiopia are:
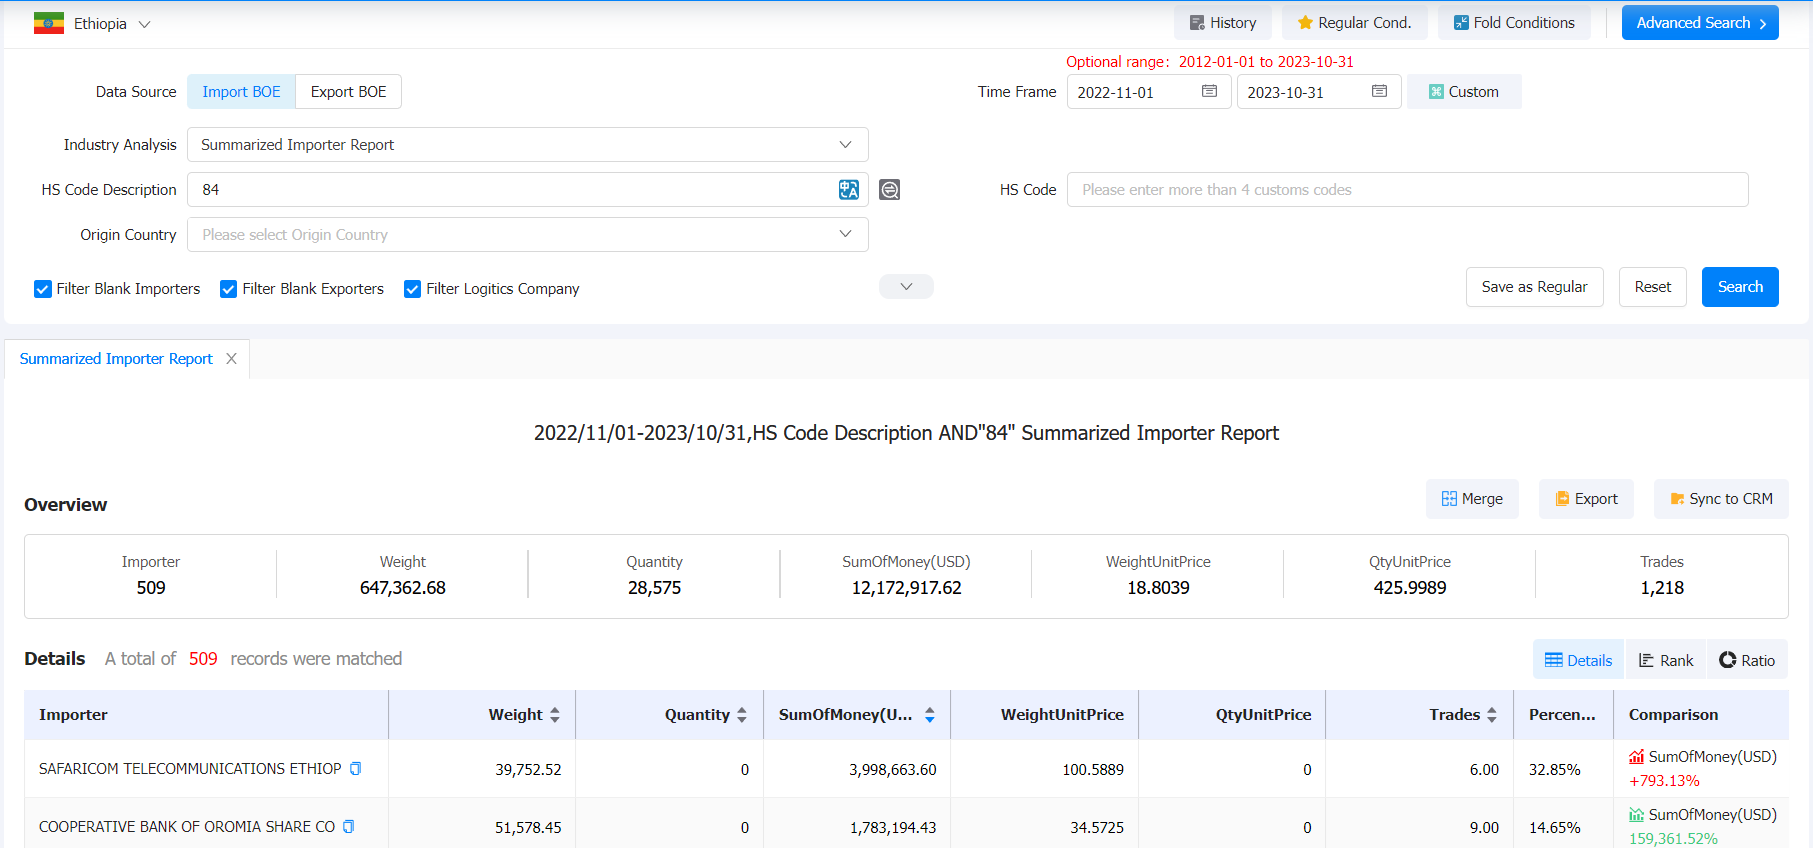
· 84 (9.72%, 1.60 billion):Nuclear reactors, boilers, machinery and mechanical appliances; parts
· 87 (9.07%, 1.50 billion):Vehicles other than railway or tramway rolling stock, and parts and accessories
· 15 (8.59%, 1.42 billion):Animal, vegetable or microbial fats and oils and their cleavage products; prepared edible fats; animal or vegetable waxes
· 85 (8.21%, 1.35 billion):Electrical machinery and equipment and parts thereof; sound recorders and reproducers, television image and sound recorders and reproducers, and parts and accessories
· 10 (8.13%, 1.34 billion):Cereals
· 31 (7.84%, 1.29 billion):Fertilizers
· 27 (6.50%, 1.07 billion):Mineral fuels, mineral oils and products of their distillation; bituminous substances; mineral waxes
· 39 (5.01%, 829 billion):Plastics and articles thereof
· 30 (4.75%, 786 billion):Pharmaceutical products
· 17 (3.55%, 587 billion):Sugars and sugar confectionery
When you need to analyze the market for the Ethiopia industry, you can find the latest Ethiopia Trade Data in Tendata's Import/Export Database by product name or 2-digit HS code.The following is a sample of what is available for you (data as of October 2023):

According to Tendata iTrader's more granular 4-digit HS codes, Ethiopia's top 10 imports (sub-categorized) are:
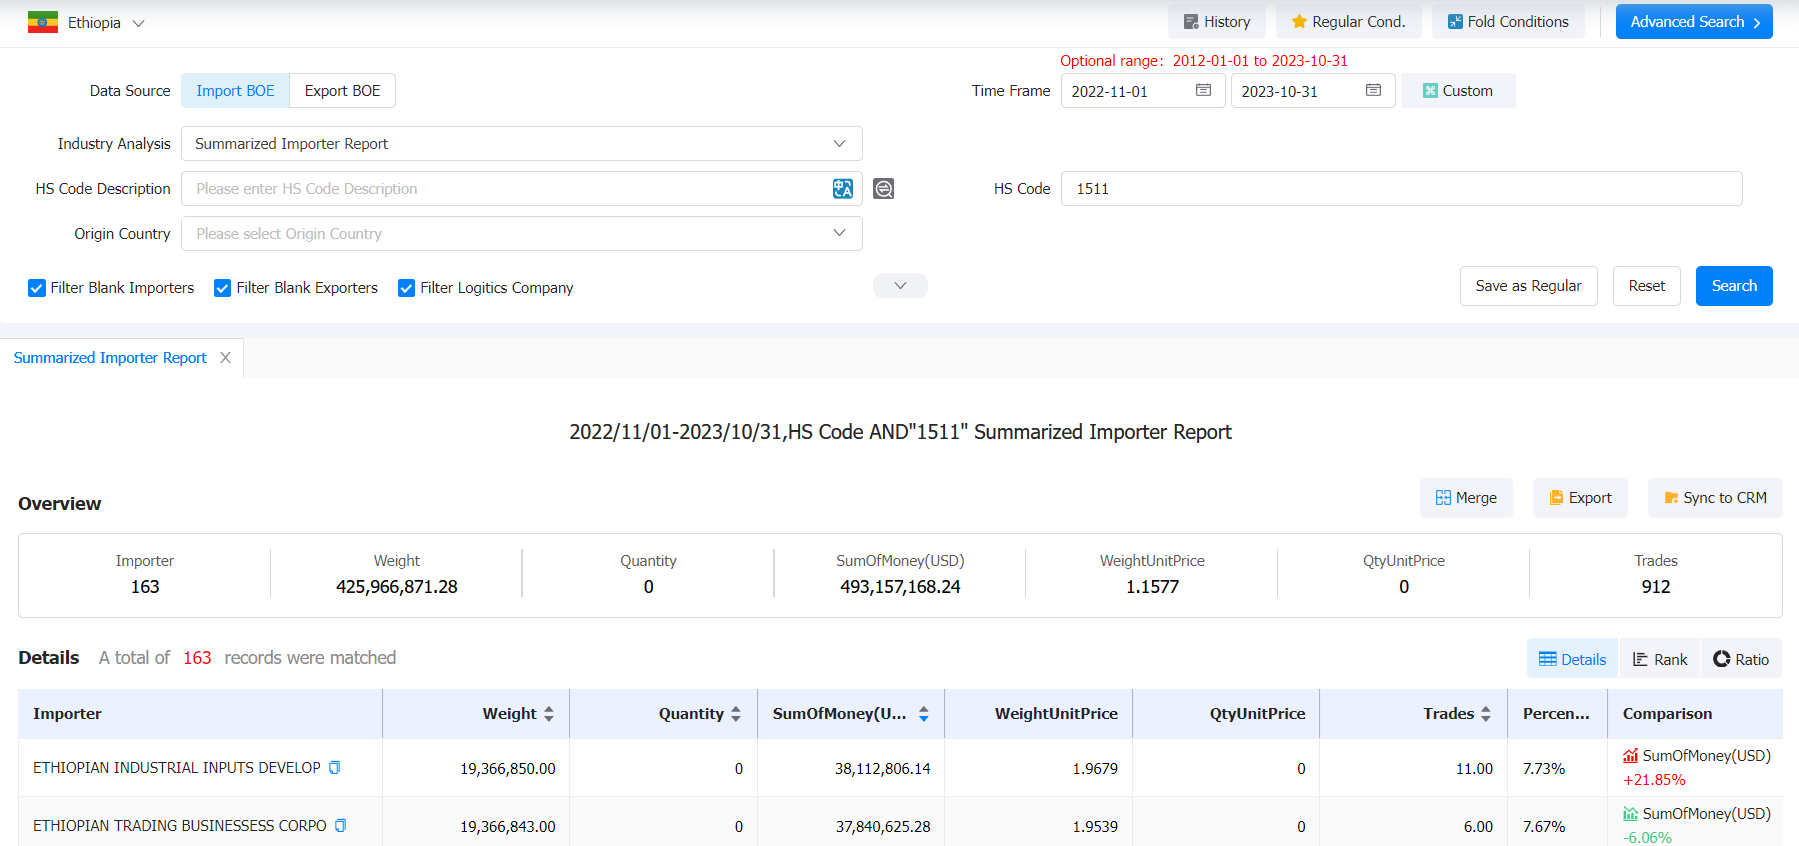
· 1511 (5.40%, $894 billion):Palm oil and its fractions, whether or not refined, but not chemically modified
· 2710 (5.38%, $891 billion):Petroleum oils and oils from bituminous minerals, not crude; waste oils
· 1001 (5.23%, $865 billion):Wheat and meslin
· 3105 (4.67%, $773 billion):Mineral or chemical fertilisers containing two or three of the fertilising elements nitrogen, phosphorus and potassium; other fertilisers
· 8703 (4.45%, $736 billion):Motor cars and other motor vehicles
· 1701 (3.49%, $577 billion):Cane or beet sugar and chemically pure sucrose, in solid form
· 3102 (3.15%, $522 billion):Mineral or chemical fertilisers, nitrogenous
· 1512 (2.77%, $459 billion):Sunflower-seed, safflower or cotton-seed oil and fractions
· 8704 (2.75%, $456 billion):Motor vehicles for the transport of goods
· 1006 (2.74%, $453 billion):Rice
When you need to look up potential Ethiopia customers for a product, you can find the latest Ethiopia Trade Data in Tendata's Import/Export database by following the 4-digit HS code.Below is a sample of what is available to you (data as of October 2023):

The latest Tendata iTrader data shows that Ethiopia's main import partners are:
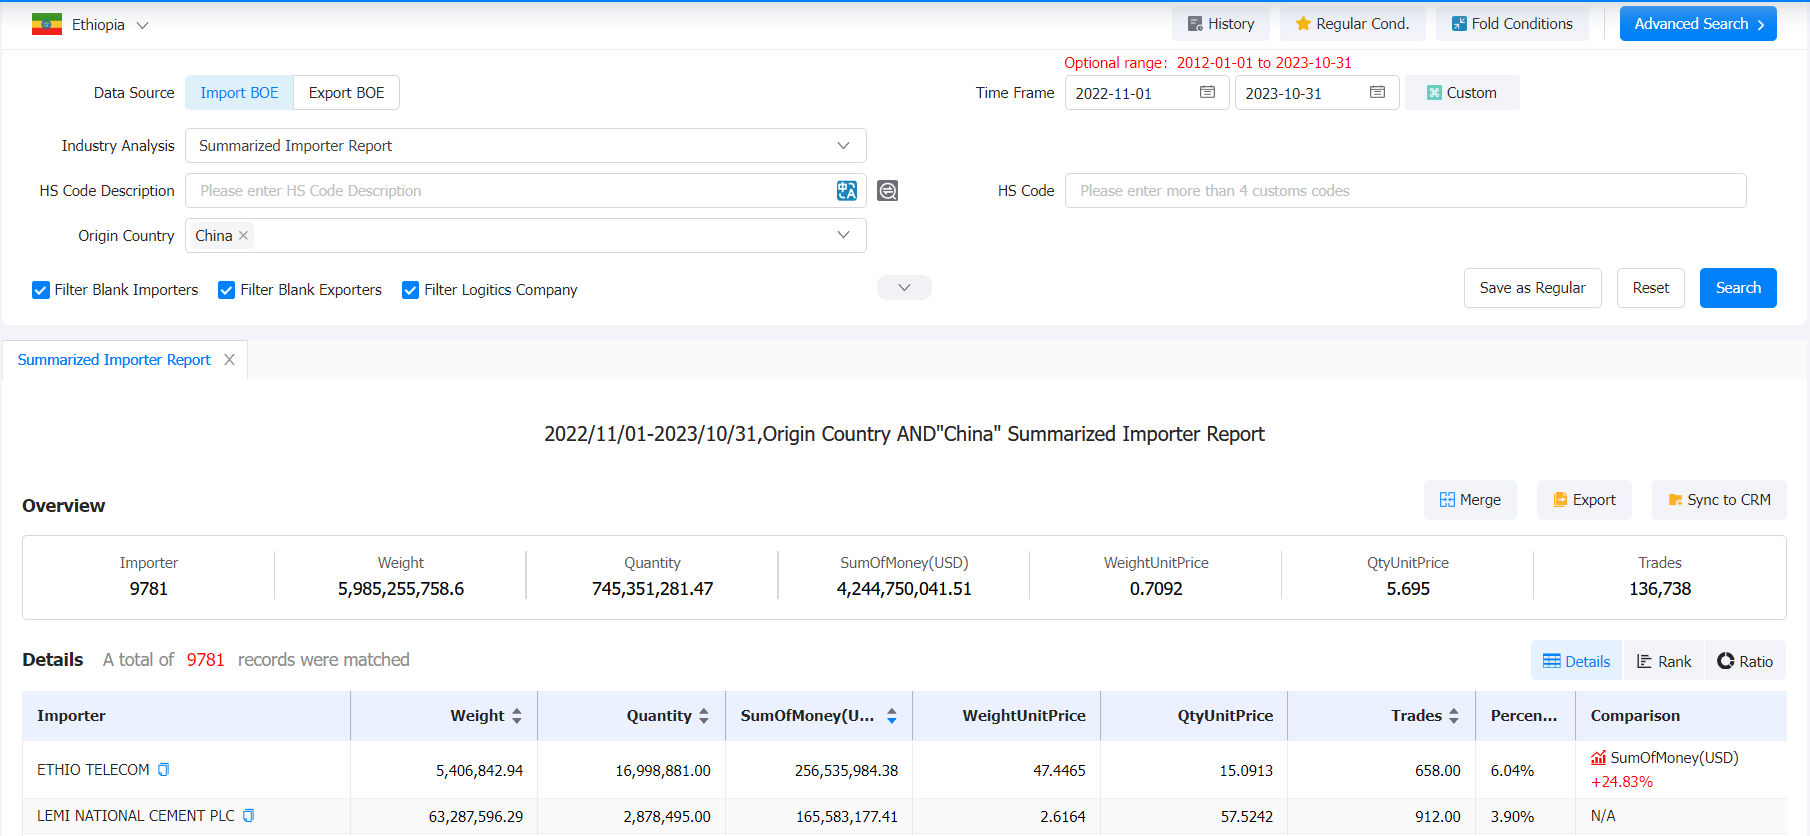
1. China (29%, 4.96 billion US$)
2. India (14.3%, 2.36 billion US$)
3. USA (6.66%, 1.1 billion US$)
4. Turkey (4.5%, 744 million US$)
5. Morocco (4.22%, 697 million US$)
6. Egypt (3.45%, 570 million US$)
7. United Arab Emirates (3.41%, 564 million US$)
8. Saudi Arabia (3.17%, 524 million US$)
9. Malaysia (3.06%, 506 million US$)
10. Japan (2.23%, 369 million US$)
When you want to know if your country cooperates with Ethiopia, you can find the latest Ethiopia Trade Data in Tendata's Import/Export Database by country name, and here is a sample of what we have found for you (data as of October 2023):

Category
Leave Message for Demo Request or Questions


 T-info
 T-discovery

 My
Tendata
 Market Analysis
 Customer
Development
 Competitor
Monitoring
 Customer Relationship


