 Trade Data
 24-11-2023
Pakistan's merchandise imports in 2022 will total $70 billion. Pakistan's total merchandise imports decreased by 3.72% from US$72 billion in 2021.
The latest Tendata iTrader data shows that according to the 2-digit HS code, Pakistan’s Top 10 imported products in October 2023 are:
· 27 (35.0%, 24 billion): Mineral fuels, mineral oils and products of their distillation; bituminous substances; mineral waxes
· 84 (6.07%, 4.26 billion): Nuclear reactors, boilers, machinery and mechanical appliances; parts
· 15 (6.04%, 4.24 billion): Animal, vegetable or microbial fats and oils and their cleavage products; prepared edible fats; anim
· 72 (5.61%, 3.94 billion): Iron and steel
· 85 (5.44%, 3.82 billion): Electrical machinery and equipment and parts thereof; sound recorders and reproducers, television im
· 29 (4.67%, 3.28 billion):Organic chemicals
· 39 (4.24%, 2.97 billion): Plastics and articles
· 87 (3.74%, 2.62 billion): Vehicles other than railway or tramway rolling stock, and parts and accessories
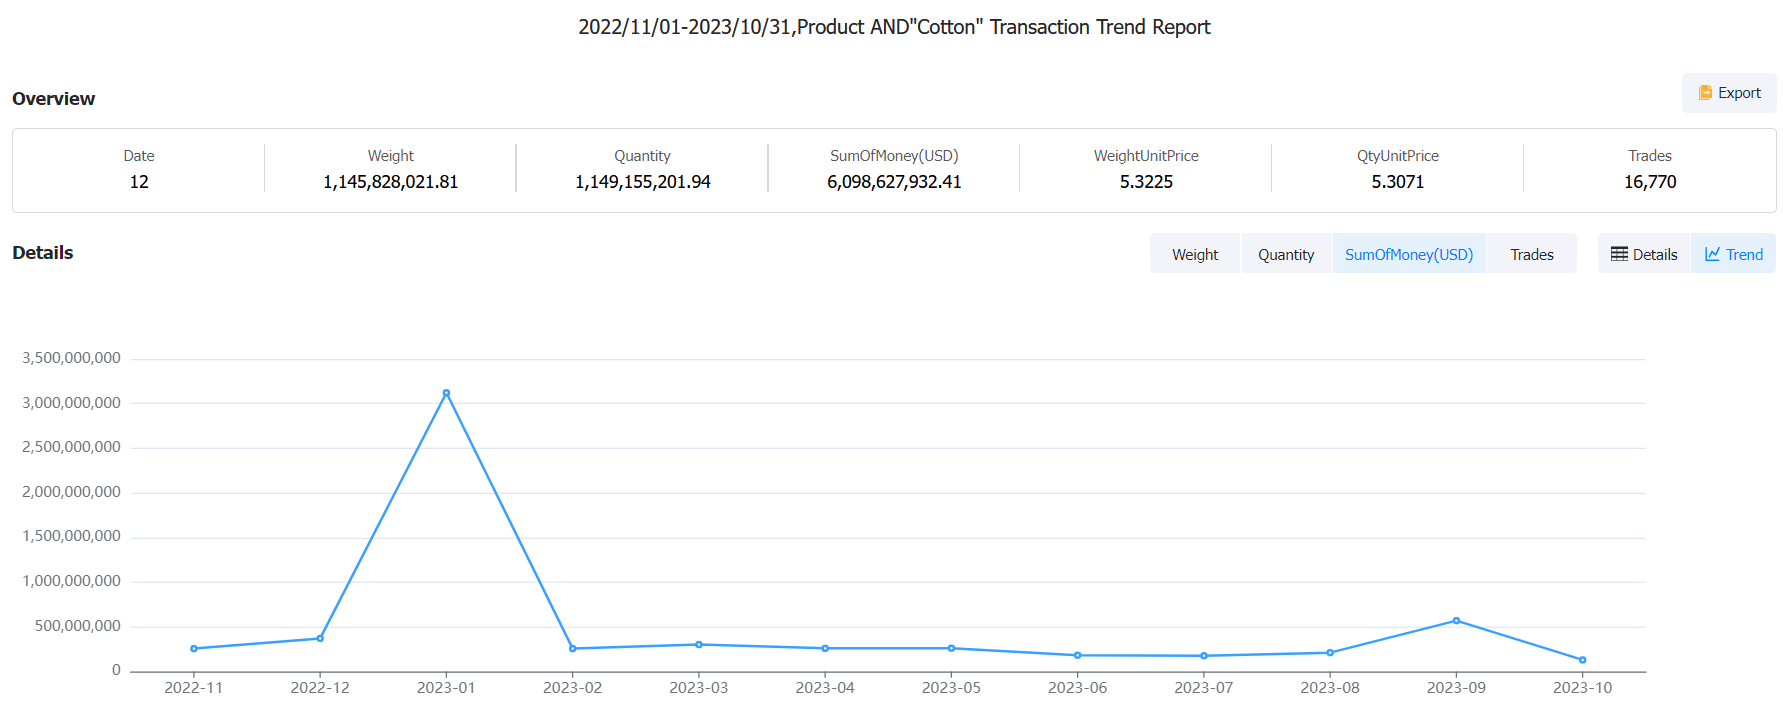
· 52 (2.92%, 2.04 billion): Cotton
· 12 (1.81%, 1.27 billion): Oil seeds and oleaginous fruits; miscellaneous grains, seeds and fruits; industrial or medicinal pla
When you need to understand the market in Pakistan, you can search using product names or HS codes in Tendata's Pakistan Import Database to obtain market trends in the entire industry. Of course, in addition to the above, Tendata also supports searching by importer name, importer address, port of departure, port of destination, bill of lading number, weight, quantity, number of containers, size, etc. You can see in the Pakistan Import Database that all fields have this data. With these Pakistan Import Database, you can quickly conduct market analysis. Here is a sample query for you (data as of October 2023):

The latest Tendata iTrader data shows that Pakistan’s main import partners are:
1.China (22%, 16.1 billion US$)
2.United Arab Emirates (11.1%, 7.84 billion US$)
3.Saudi Arabia (7.24%, 5.08 billion US$)
4. Indonesia (6.96%, 4.89 billion US$)
5.Qatar (5.82%, 4.08 billion US$)
6.USA (4.38%, 3.07 billion US$)
7.Kuwait (4.33%, 3.04 billion US$)
8.Japan (2.37%, 1.66 billion US$)
9.Thailand (2.04%, 1.43 billion US$)
10.Brazil (2.02%, 1.42 billion US$)
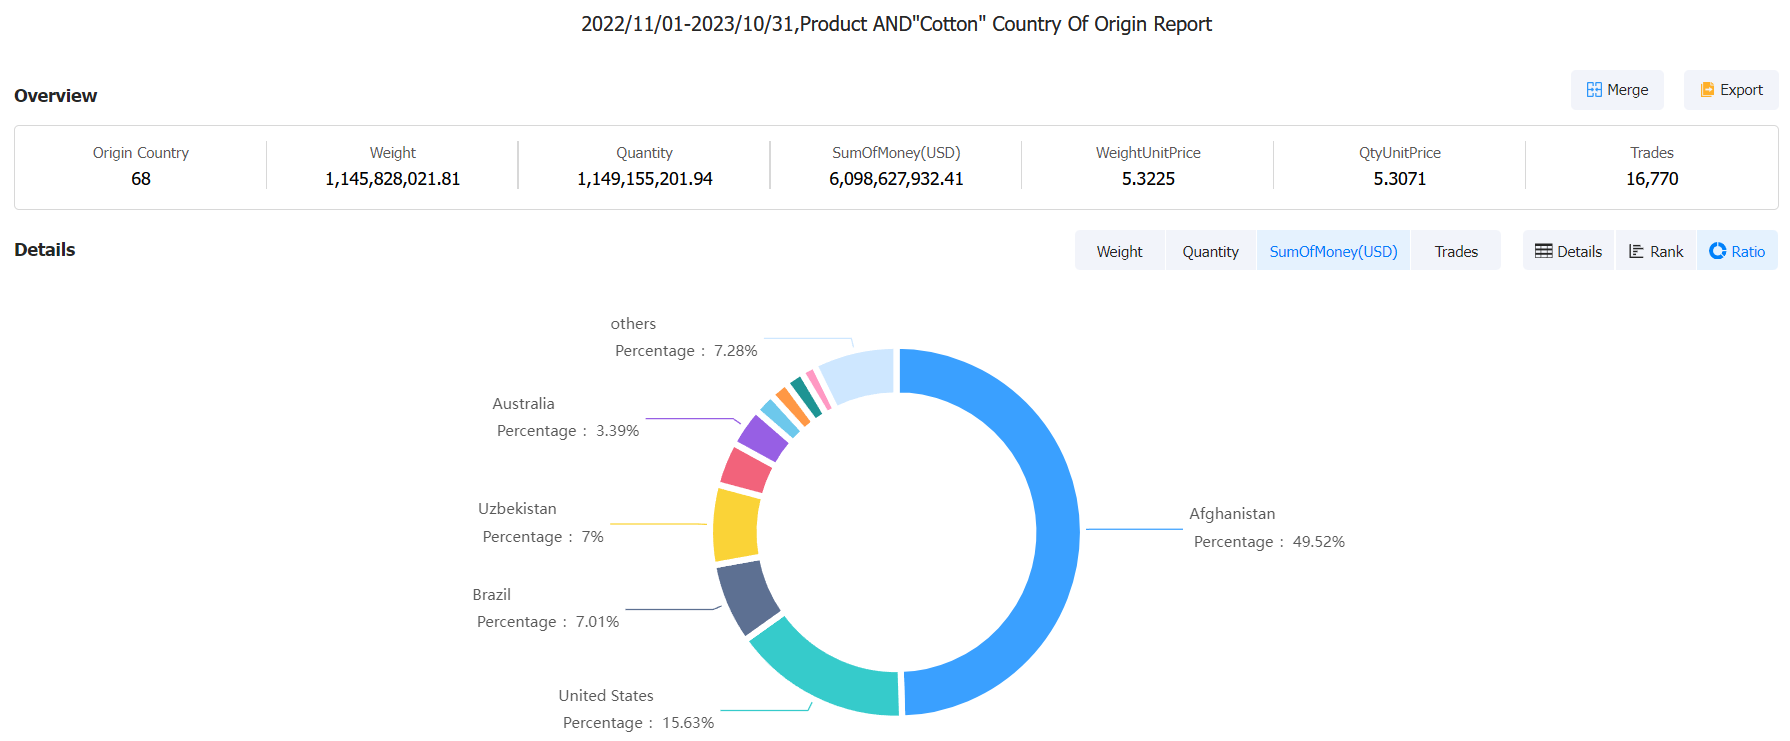
When you want to know whether Pakistan importers tend to work with exporters in your country, you can search in Tendata's Pakistan Import Database by country name. Don't forget to select a time range to get the latest import and export data. Here is a sample query for you (data as of October 2023):

Category
Leave Message for Demo Request or Questions


 T-info
 T-discovery

 My
Tendata
 Market Analysis
 Customer
Development
 Competitor
Monitoring
 Customer Relationship


