 Trade Data
 2023-11-22
Spice imports generally refer to the international trade in spices - aromatic or pungent plant substances used to flavor food or beverages. Spices have been an important part of global trade for centuries.
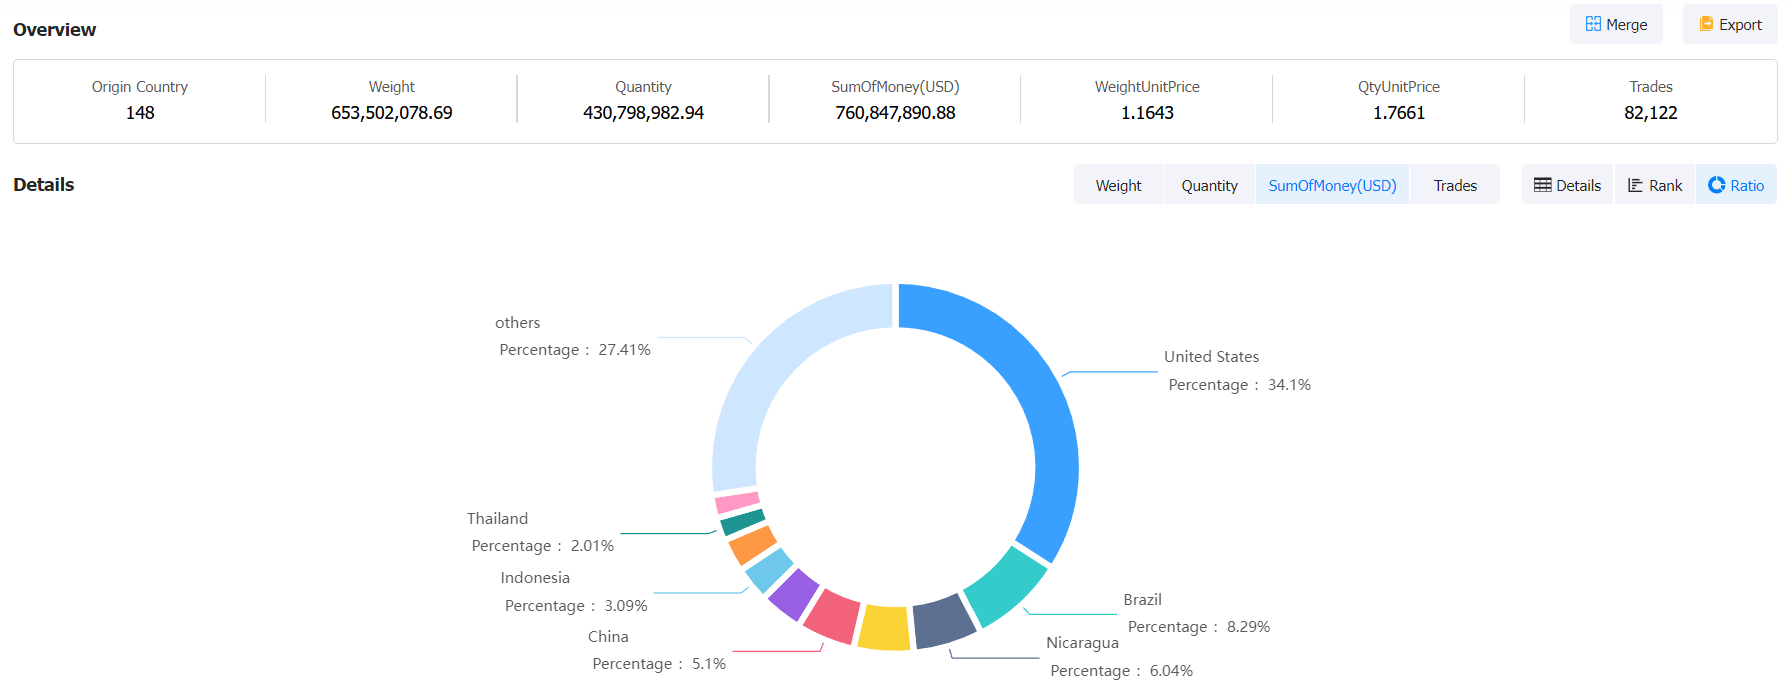
In 2023, the major spice importing countries are:
1. United States (34.09%, $2594.07 Million): black pepper, cinnamon, cayenne pepper, vanilla, ginger
2. Brazil (8.29%, $630.75 Million): black pepper, clove, cinnamon, cardamom
3.Nicaragua (6.04%, $459.89 Million)
4.Poland (5.21%, $396.68 Million): Vanilla, Pepper
5. China (5.1%, $388.32 Million): ginger, garlic, star anise, fennel, peppercorns
6. Argentina (3.82%, $290.63 Million): chili, cinnamon, vanilla
7. Indonesia (3.09%, $235.09 Million): cloves, cinnamon, fennel, pepper
8. India (2.92%, $222.45 Million): cumin, cinnamon, cumin, pepper, dill
9. Thailand (2.01%, $152.9 Million): cinnamon, lemongrass, chili pepper
10. Germany (2%, $152.54 Million): cinnamon, vanilla, mustard
You can see the information Tendata provides on spice importers in the chart below:

Drilling down to more specific HS codes, you can see country-specific information on major spice imports, as well as the major spice importers for each country.
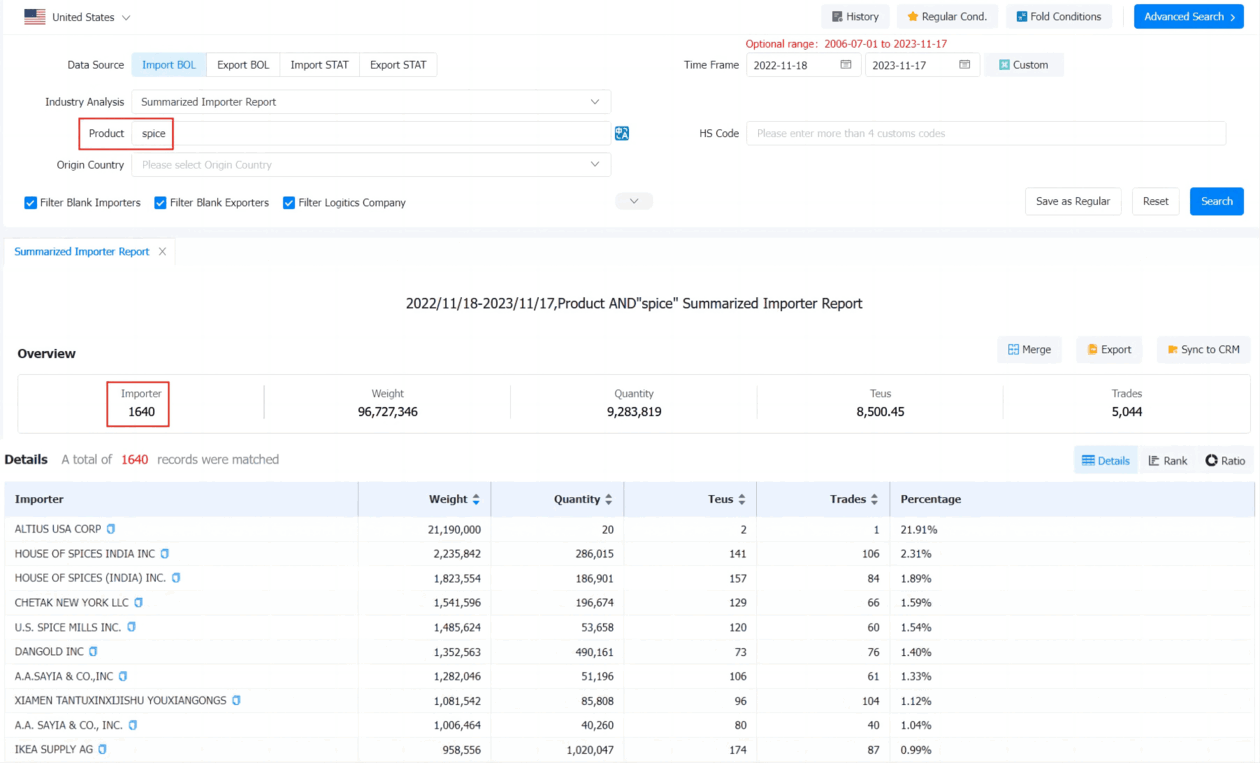
Using the United States as an example, you can see the leading importers of spices in the United States in 2023:
1.ALTIUS USA CORP (21.91%, $0 Million)
2.HOUSE OF SPICES INDIA INC (2.31%, $2.86 Million)
3.HOUSE OF SPICES (INDIA) INC.(1.89%, $1.87 Million)
4.CHETAK NEW YORK LLC (1.59%, $1.97 Million)
5.U.S. SPICE MILLS INC.(1.54%, $0.54 Million)
6.DANGOLD INC (1.4%, $4.9 Million)
7.a.a. sayia & co., inc (1.33%, $0.51 Million)
8.XIAMEN TANTUXINXIJISHU YOUXIANGONGS (1.12%, $0.86 Million)
9.a.a. sayia & co., inc.(1.04%, $0.4 Million)
10.IKEA SUPPLY AG (0.99%, $10.2 Million)

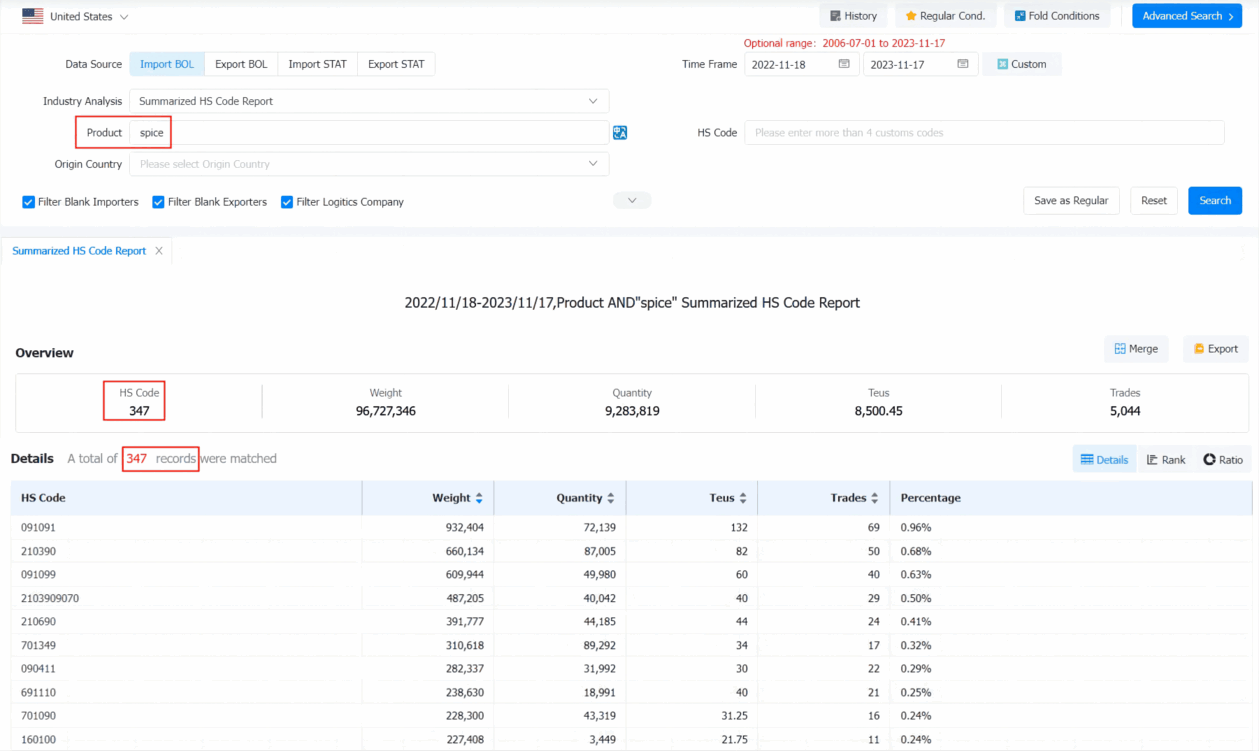
Using the US as an example, you can see the main HS codes for imported spices in the US in 2023:
1.91091 (0.96%, $0.72 Million)
2.210390 (1.18%, $0.87 Million)
3.91099 (0.63%, $0.5 Million)
4.210690 (0.41%, $0.44 Million)
5.210690 (0.41%, $0.44 Million)
6.701349 (0.32%, $0.89 Million)
7.90411 (0.29%, $0.32 Million)
8.691110 (0.25%, $0.19 Million)
9.701090 (0.24%, $0.43 Million)
10.160100 (0.24%, $0.03 Million)

How Shanghai Tendata Empowers Growth with Foreign Trade Big Data?
Tendata iTrader is a versatile foreign trade application tool and a great asset for professionals in the international trade industry.
(1) Real-time Access to Comprehensive Global Data: Tendata iTrader offers real-time access to customs data from 91 countries, customs code inquiries, and an extensive collection of foreign trade supply chain data, import-export statistics, and international company data. Companies can freely select the foreign trade databases corresponding to their trade regions and use nine different search methods to tailor their data queries based on single or multiple criteria. The search results can generate 19 types of market reports, and users can perform online comparative analyses as well. (>>> Click to use The Data Online for Free)
(2) Detailed Transaction Records from 91 Countries: Tendata's data system automatically integrates millions of accurate buyer information, detailed transaction data from 91 countries, and competitor details. It intelligently generates various data analysis reports, empowering companies to analyze competitors, maintain relationships with new and existing customers, and stay up-to-date with real-time international trade information. How is Shanghai Tendata performing?(>>> Click for Free Demo)
(3) Internet Search of Email Addresses in 153 Countries: With Tendata's proprietary web crawling technology, companies can access and validate email addresses in 153 countries, making mass email campaigns worry-free. Potential customers are automatically categorized by level, allowing users to find decision-makers within a minute. Choose from various email templates with unlimited sending capabilities. Tendata's data effectiveness is quite impressive. (>>> Click for More Details)

Category
Leave Message for Demo Request or Questions


 T-info
 T-discovery

 My
Tendata
 Market Analysis
 Customer
Development
 Competitor
Monitoring
 Customer Relationship


