 Market Insights
 01-04-2025
In 2023, the total global vinegar exports reached an estimated value of US$846.5 million.
Over the past five years, the worldwide vinegar trade experienced an overall increase of 20.5%, rising from $702.4 million in 2019. However, on a year-over-year basis, vinegar exports saw a marginal growth of 0.04% from $846.1 million in 2022.
Vinegar is an acetic acid-based liquid, varying in concentration. Commercially produced vinegar undergoes a fermentation process that can range from a few months to a year. It is widely utilized in pickling solutions, vinaigrettes, salad dressings, sauces, mustard, ketchup, mayonnaise, soups, and beverages. Additionally, vinegar serves as an effective natural cleaning agent.
By value, five key exporters—Italy, the United States, Spain, France, and Germany—were responsible for 66.4% of total global vinegar shipments in 2023.
From a continental standpoint, European countries led vinegar exports with a total worth of $620.3 million, representing 73.3% of worldwide shipments. Asia followed with 15.2%, while North America contributed 9.8%. The remaining shares originated from Latin America (0.8%, excluding Mexico but including the Caribbean), Africa (0.6%), and Oceania (0.3%), with Australia and New Zealand being notable contributors.
The five largest vinegar importers in 2023 were the United States, Germany, France, Canada, and the United Kingdom. Combined, these nations accounted for 46.6% of all imported vinegar by value.
In comparison to the concentrated supplier base (66.4% from the top five exporters), the import market was more diversified, involving 217 importing countries, islands, and territories.
Regarding regional import distribution, European countries led with 51.9% of total global imports, followed by North America (25.5%), Asia (14.6%), Latin America (3.4%, excluding Mexico but including the Caribbean), Oceania (2.9%, dominated by Australia and New Zealand), and Africa (1.7%).
Under the Harmonized Tariff System (HTS), vinegar, including fermented vinegar and substitutes made from acetic acid, is categorized under the six-digit code 220900.

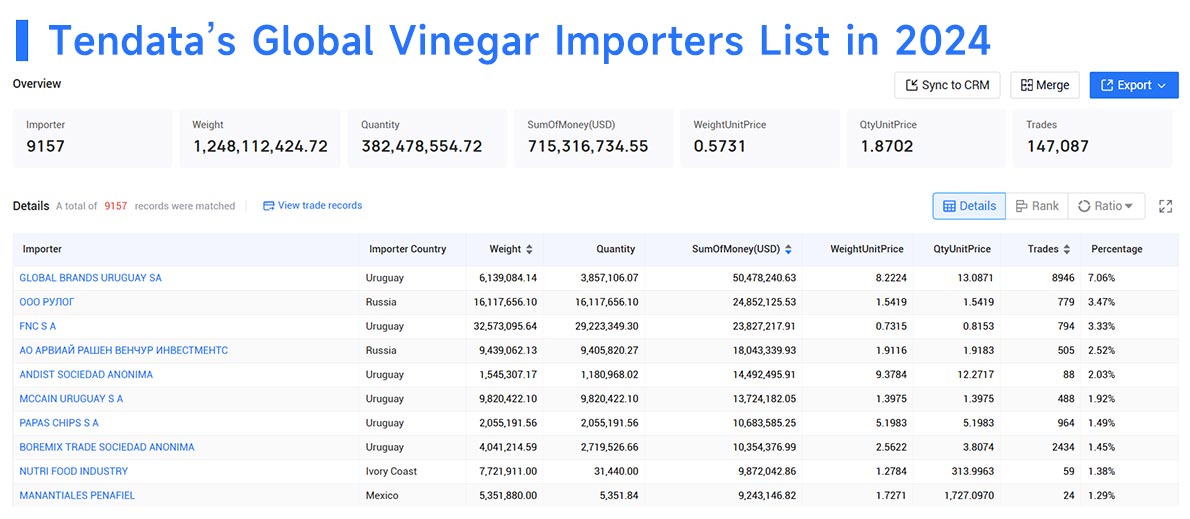
Top Vinegar Imports by Company
1.GLOBAL BRANDS URUGUAY SA(7.06%, $50.48 Million)
2.ООО РУЛОГ(3.47%, $24.85 Million)
3.FNC S A(3.33%, $23.83 Million)
4.АО АРВИАЙ РАШЕН ВЕНЧУР ИНВЕСТМЕНТС(2.52%, $18.04 Million)
5.ANDIST SOCIEDAD ANONIMA(2.03%, $14.49 Million)
6.MCCAIN URUGUAY S A(1.92%, $13.72 Million)
7.PAPAS CHIPS S A(1.49%, $10.68 Million)
8.BOREMIX TRADE SOCIEDAD ANONIMA(1.45%, $10.35 Million)
9.NUTRI FOOD INDUSTRY(1.38%, $9.87 Million)
10.MANANTIALES PENAFIEL(1.29%, $9.24 Million)

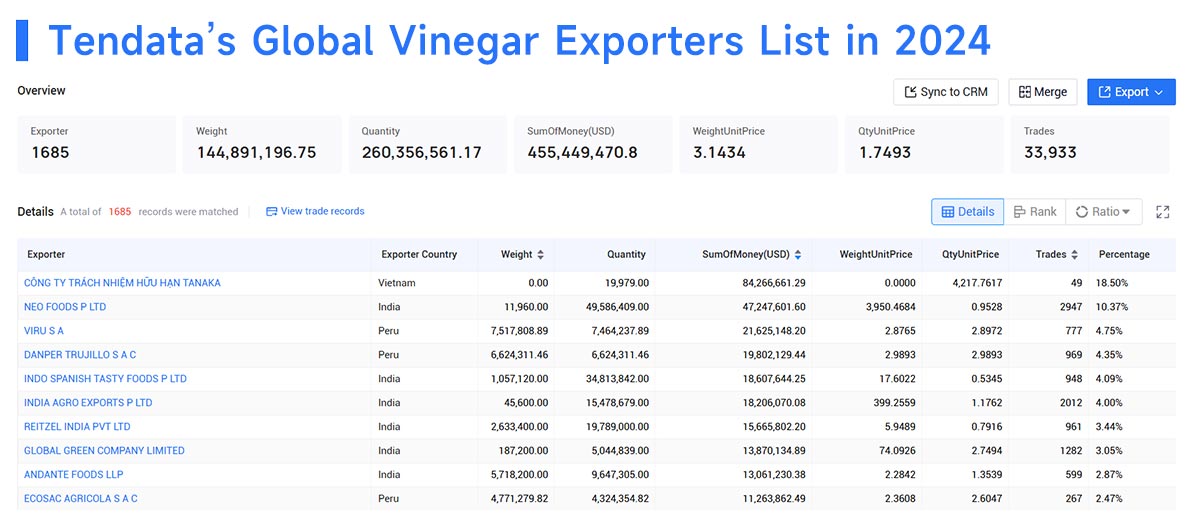
Top Vinegar Exports by Company
1.CÔNG TY TRÁCH NHIỆM HỮU HẠN TANAKA(18.5%, $84.27 Million)
2.NEO FOODS P LTD(10.37%, $47.25 Million)
3.VIRU S A(4.75%, $21.63 Million)
4.DANPER TRUJILLO S A C(4.35%, $19.8 Million)
5.INDO SPANISH TASTY FOODS P LTD(4.09%, $18.61 Million)
6.INDIA AGRO EXPORTS P LTD(4%, $18.21 Million)
7.REITZEL INDIA PVT LTD(3.44%, $15.67 Million)
8.GLOBAL GREEN COMPANY LIMITED(3.05%, $13.87 Million)
9.ANDANTE FOODS LLP(2.87%, $13.06 Million)
10.ECOSAC AGRICOLA S A C(2.47%, $11.26 Million)

Leading Vinegar Exporting Countries (2023)
Below are the top 20 vinegar-exporting nations, ranked by export value:
1.Italy: US$332.3 million (39.3% of global exports)
2.United States: $78 million (9.2%)
3.Spain: $59 million (7%)
4.France: $49.2 million (5.8%)
5.Germany: $43.8 million (5.2%)
6.South Korea: $41.2 million (4.9%)
7.Netherlands: $26.7 million (3.2%)
8.China: $26.3 million (3.1%)
9.United Kingdom: $24.1 million (2.8%)
10.Japan: $22.1 million (2.6%)
11.Greece: $20.3 million (2.4%)
12.Czech Republic: $16.6 million (2%)
13.Belgium: $11.5 million (1.4%)
14.Philippines: $9.6 million (1.1%)
15.Slovakia: $6.5 million (0.8%)
16.Portugal: $5.7 million (0.7%)
17.Hong Kong: $5.3 million (0.6%)
18.Poland: $4.9 million (0.6%)
19.Türkiye: $4.8 million (0.6%)
20.Taiwan: $4.7 million (0.6%)
These top 20 countries collectively accounted for 93.6% of the global vinegar exports in 2023.
Among the fastest-growing exporters since 2022 were Greece (+12.9%), China (+7.2%), Spain (+6.9%), and Italy (+6.0%). Meanwhile, countries experiencing notable declines in vinegar exports included Poland (-42.6%), South Korea (-38.8%), Hong Kong (-14.1%), Türkiye (-12.4%), and the United States (-6.8%).
Leading Vinegar Importing Countries (2023)
The total cost of global vinegar imports in 2023 was approximately US$911.7 million, reflecting a 21.6% increase over the past five years and a 1.5% rise compared to 2022.
Below are the 20 leading vinegar-importing countries, ranked by value:
1.United States: US$168.8 million (18.5% of global imports)
2.Germany: $90.2 million (9.9%)
3.France: $70.9 million (7.8%)
4.Canada: $50.9 million (5.6%)
5.United Kingdom: $44.1 million (4.8%)
6.Italy: $43.3 million (4.7%)
7.Netherlands: $31.7 million (3.5%)
8.Switzerland: $25.4 million (2.8%)
9.South Korea: $24.2 million (2.7%)
10.Austria: $20.1 million (2.2%)
11.Australia: $19.8 million (2.2%)
12.Spain: $19.4 million (2.1%)
13.Belgium: $14.7 million (1.6%)
14.Sweden: $12.9 million (1.4%)
15.Mexico: $12.5 million (1.4%)
16.Japan: $11.3 million (1.2%)
17.Poland: $10.4 million (1.1%)
18.Hungary: $10.1 million (1.1%)
19.Hong Kong: $9.8 million (1.1%)
20.Singapore: $9.7 million (1.1%)
These 20 countries collectively imported 76.8% of all globally traded vinegar in 2023.
The fastest-growing vinegar importers since 2022 included Italy (+38.4%), South Korea (+28.4%), Austria (+21.1%), and Mexico (+18.1%). Conversely, countries with significant declines in vinegar imports included Hong Kong (-18.9%), Australia (-14.2%), the United States (-8.3%), Poland (-4.1%), and Japan (-3.5%).
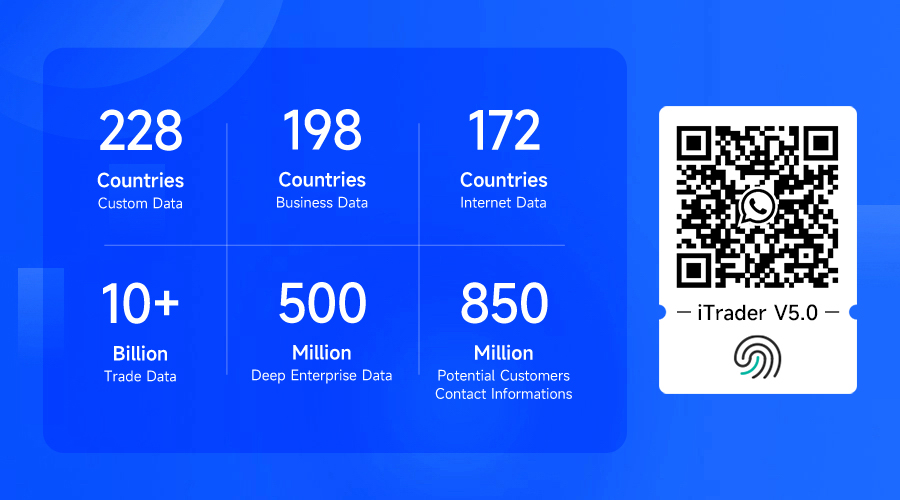
Trade Data: Tendata has accumulated 10 billion+ trade transaction details
from 228+ countries and regions, supporting one-click query of major import and
export countries, customer distribution, product volume and price, etc., which
helps import and export enterprises to accurately understand the global market
and the trade environment of the target market.
Business Data: Tendata has a total of 500 million+ in-depth enterprise data, involving 198 countries and 230+ industry segments, covering the current operation status, financial information, product information, business relationships, intellectual property rights, etc. The data is fine, which makes it easy to assess the real strength of the target customers in depth, and expand the potential customer base.
Internet Data: Tendata's total of 850 million+ contact data, integrating social media, Collingwood, emails and other multi-channel contacts, helps to reach key contacts of enterprises with one click and improve the efficiency of customer development, as well as news and public opinion monitoring, which helps to grasp the Internet information in a timely manner.

Category
Leave Message for Demo Request or Questions


 T-info
 T-discovery

 My
Tendata
 Market Analysis
 Customer
Development
 Competitor
Monitoring
 Customer Relationship


