 Market Insights
 01-04-2025
In 2023, the global nutmeg export market was valued at approximately US$237.5 million. The figures presented here pertain specifically to nutmeg and do not include mace, which is the seed covering of the nutmeg fruit.
Over the past five years, nutmeg exports have seen a substantial increase of 34.2% compared to 2019, when global sales stood at $177 million. However, in a year-over-year comparison, export revenues declined by 7.3%, down from $256.2 million in 2022.
Nutmeg is derived from the seed of an evergreen tree and is a popular spice in various cuisines. It enhances the flavors of soups, stews, gravies, vegetable dishes, desserts, and beverages such as mulled cider and eggnog. Additionally, it is a key ingredient in pumpkin pie, baked squash, and rum-based drinks. Nutmeg is also widely used in confectionery, essential oils, and specialty butter.
By value, five countries—Indonesia, India, Vietnam, the Netherlands, and Sri Lanka—were responsible for 80.6% of all nutmeg exports in 2023.
From a regional perspective, Asia led the global nutmeg trade, contributing $191.9 million (80.8% of total exports). Europe followed with 17.7%, while North America accounted for 1.1%. Smaller shares were attributed to Latin America (0.3%, excluding Mexico), Africa (0.1%), and Oceania (0.05%), where Australia was a notable exporter.
The five leading importers of nutmeg in 2023 were China, Germany, the United States, the Netherlands, and Vietnam. These nations collectively purchased 47.2% of all globally imported nutmeg by value.
In total, 72 countries exported nutmeg in 2023, a relatively concentrated supplier base compared to the 170+ nations and territories that imported the spice. The top five importers accounted for a smaller share (47.2%) of total imports, illustrating a broader demand distribution.
On a continental basis, Asia was the dominant buyer of imported nutmeg, accounting for 67.2% of global spending. Europe followed with 20%, Latin America (excluding Mexico) at 5%, Africa at 3.9%, North America at 3.8%, and Oceania (led by Australia) at 0.1%.

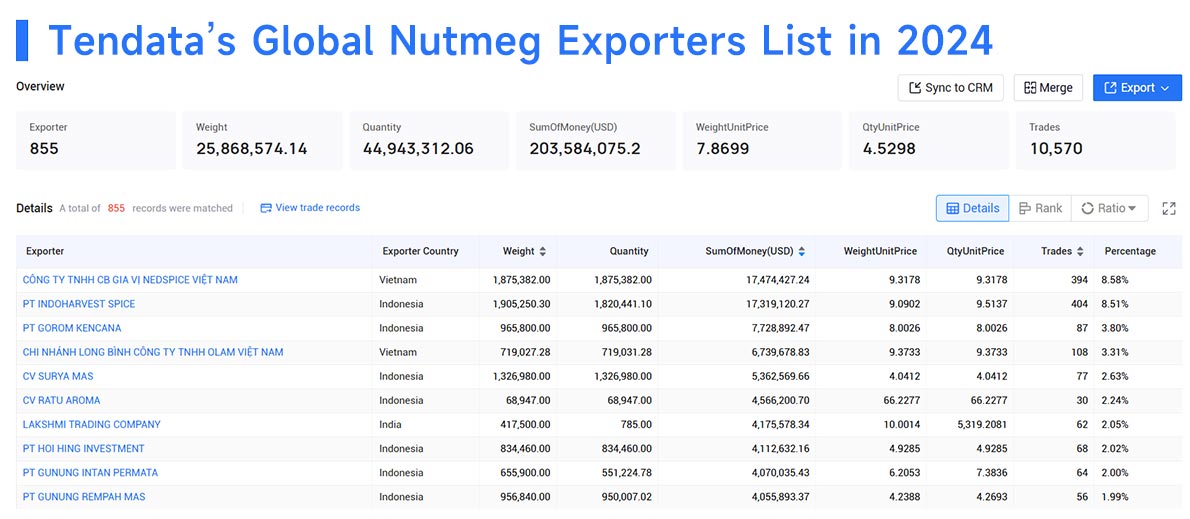
Top Nutmeg Exports by Company
1.CÔNG TY TNHH CB GIA VỊ NEDSPICE VIỆT NAM(8.58%, $17.47 Million)
2.PT INDOHARVEST SPICE(8.51%, $17.32 Million)
3.PT GOROM KENCANA(3.8%, $7.73 Million)
4.CHI NHÁNH LONG BÌNH CÔNG TY TNHH OLAM VIỆT NAM(3.31%, $6.74 Million)
5.CV SURYA MAS(2.63%, $5.36 Million)
6.CV RATU AROMA(2.24%, $4.57 Million)
7.LAKSHMI TRADING COMPANY(2.05%, $4.18 Million)
8.PT HOI HING INVESTMENT(2.02%, $4.11 Million)
9.PT GUNUNG INTAN PERMATA(2%, $4.07 Million)
10.PT GUNUNG REMPAH MAS(1.99%, $4.06 Million)

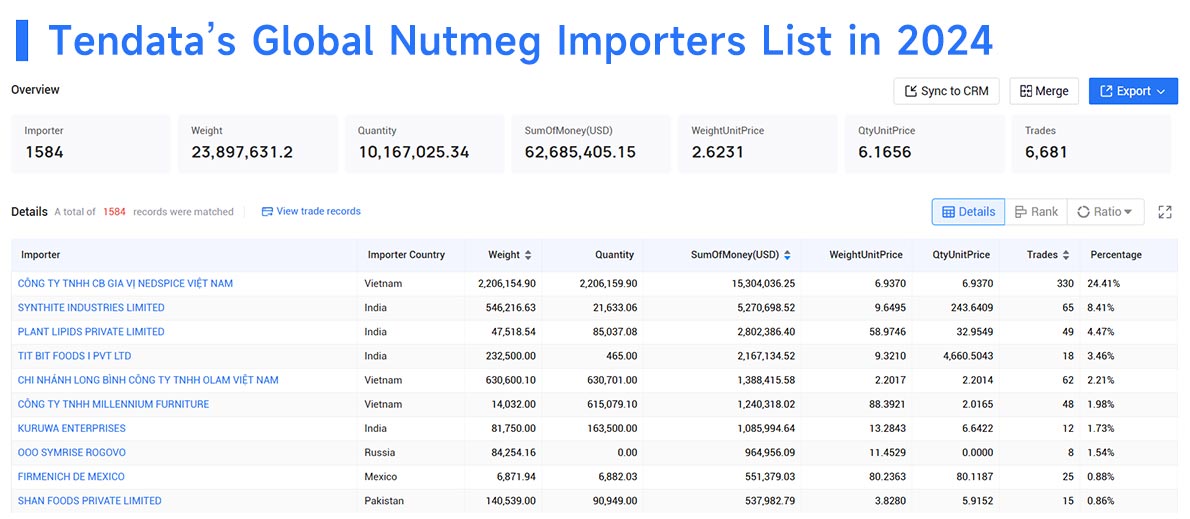
Top Nutmeg Imports by Company
1.CÔNG TY TNHH CB GIA VỊ NEDSPICE VIỆT NAM(24.41%, $15.3 Million)
2.SYNTHITE INDUSTRIES LIMITED(8.41%, $5.27 Million)
3.PLANT LIPIDS PRIVATE LIMITED(4.47%, $2.8 Million)
4.TIT BIT FOODS I PVT LTD(3.46%, $2.17 Million)
5.CHI NHÁNH LONG BÌNH CÔNG TY TNHH OLAM VIỆT NAM(2.21%, $1.39 Million)
6.CÔNG TY TNHH MILLENNIUM FURNITURE(1.98%, $1.24 Million)
7.KURUWA ENTERPRISES(1.73%, $1.09 Million)
8.OOO SYMRISE ROGOVO(1.54%, $0.96 Million)
9.FIRMENICH DE MEXICO(0.88%, $0.55 Million)
10.SHAN FOODS PRIVATE LIMITED(0.86%, $0.54 Million)

Leading Nutmeg Exporting Nations (2023)
Below are the top 20 exporters of nutmeg, ranked by export value:
1.Indonesia: $112 million (47.2% of total exports)
2.India: $29.1 million (12.3%)
3.Vietnam: $20.5 million (8.6%)
4.Netherlands: $15.7 million (6.6%)
5.Sri Lanka: $14.1 million (5.9%)
6.United Arab Emirates: $12.1 million (5.1%)
7.Germany: $7.9 million (3.3%)
8.Italy: $3.9 million (1.6%)
9.Belgium: $3.7 million (1.6%)
10.France: $2.2 million (0.9%)
11.Spain: $1.9 million (0.8%)
12.Austria: $1.8 million (0.8%)
13.United States: $1.4 million (0.6%)
14.Poland: $1.3 million (0.6%)
15.Canada: $1.1 million (0.5%)
16.Malaysia: $923,000 (0.4%)
17.United Kingdom: $918,000 (0.4%)
18.Saudi Arabia: $880,000 (0.4%)
19.China: $779,000 (0.3%)
20.Czech Republic: $750,000 (0.3%)
These nations accounted for 98.1% of total nutmeg exports in 2023.
Among the fastest-growing exporters since 2022 were the Czech Republic (+100%), Poland (+34%), Belgium (+16.3%), France (+13.5%), China (+12.4%), and India (+11.5%).
Conversely, the largest declines were observed in Canada (-48.8%), the United States (-43.4%), Spain (-31%), Malaysia (-21.4%), and the Netherlands (-17.5%).
Leading Nutmeg Importing Nations (2023)
The global import value of nutmeg rose by 39.6% over five years but declined by 6.7% year over year since 2022.
Top 20 importing nations by value:
1.China: $44.7 million (19.9% of total imports)
2.Germany: $17.6 million (7.8%)
3.United States: $16.3 million (7.3%)
4.Netherlands: $13.7 million (6.1%)
5.Vietnam: $13.5 million (6%)
6.United Arab Emirates: $12.1 million (5.4%)
7.France: $7.1 million (3.2%)
8.Italy: $6.78 million (3%)
9.India: $6.78 million (3%)
10.Belgium: $6.77 million (3%)
11.Japan: $6.3 million (2.8%)
12.United Kingdom: $6 million (2.7%)
13.Spain: $4.2 million (1.9%)
14.Iraq: $3.53 million (1.6%)
15.Canada: $3.46 million (1.5%)
16.Poland: $2.96 million (1.3%)
17.Austria: $2.89 million (1.3%)
18.Argentina: $2.59 million (1.2%)
19.Brazil: $2.58 million (1.2%)
20.Egypt: $2.4 million (1.1%)
These 20 nations represented 81.2% of global nutmeg imports in 2023.
Among the top-growing import markets were Iraq (+44.4%), Poland (+37.5%), China (+28.7%), Belgium (+28.3%), and Germany (+1.2%). Meanwhile, the largest declines were recorded in Egypt (-50.1%), Canada (-38.6%), Vietnam (-32.7%), Spain (-23.9%), and the United States (-23.4%).
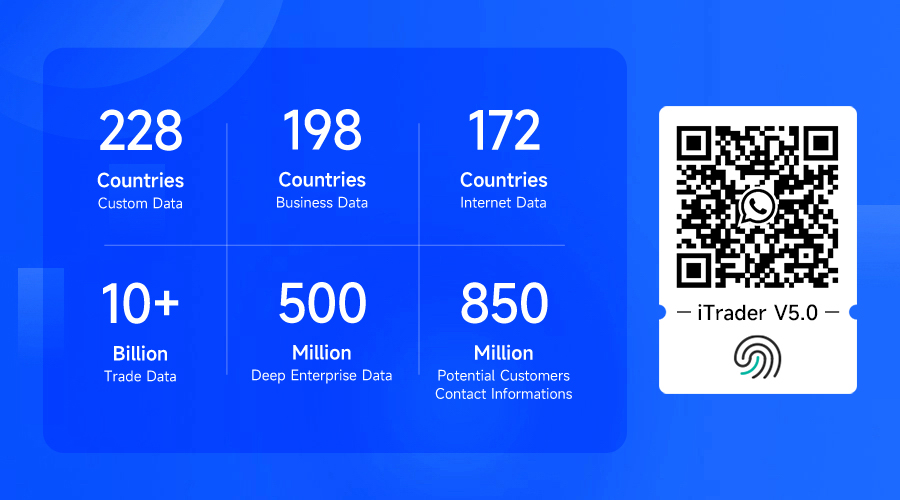
Trade Data: Tendata has accumulated 10 billion+ trade transaction details
from 228+ countries and regions, supporting one-click query of major import and
export countries, customer distribution, product volume and price, etc., which
helps import and export enterprises to accurately understand the global market
and the trade environment of the target market.
Business Data: Tendata has a total of 500 million+ in-depth enterprise data, involving 198 countries and 230+ industry segments, covering the current operation status, financial information, product information, business relationships, intellectual property rights, etc. The data is fine, which makes it easy to assess the real strength of the target customers in depth, and expand the potential customer base.
Internet Data: Tendata's total of 850 million+ contact data, integrating social media, Collingwood, emails and other multi-channel contacts, helps to reach key contacts of enterprises with one click and improve the efficiency of customer development, as well as news and public opinion monitoring, which helps to grasp the Internet information in a timely manner.

Category
Leave Message for Demo Request or Questions


 T-info
 T-discovery

 My
Tendata
 Market Analysis
 Customer
Development
 Competitor
Monitoring
 Customer Relationship


