 Market Insights
 31-03-2025
In 2023, the total value of global salt exports reached approximately $3.4 billion.
Compared to 2019, when international salt sales were valued at $2.85 billion, the market has experienced an average growth of 19.1%. On a year-over-year basis, global salt export revenues saw a modest 1% increase from $3.36 billion in 2022.
Primarily composed of sodium chloride, salt is a widely utilized mineral. However, only around 6% of total salt production is designated for food consumption. The remaining portion serves various applications, including water treatment, de-icing roads and sidewalks, and agricultural uses. Additionally, salt is an essential component in manufacturing products such as soap, aluminum, paper pulp, synthetic rubber, and pottery glaze.
In 2023, the Netherlands, Germany, India, the United States, and Chile emerged as the top five salt-exporting nations, collectively accounting for 45.5% of the world's total salt exports.
From a regional standpoint, Europe dominated the salt export market with $1.6 billion in sales, contributing 47.1% to global exports. Asia followed with a 22.8% share, while North America accounted for 13.2%. Other contributors included Latin America (8.4%, excluding Mexico but including the Caribbean), Africa (8.1%), and Oceania (0.5%), primarily represented by New Zealand.
On the import side, the leading salt purchasers in 2023 were the United States, China, Japan, Germany, and South Korea. Together, these five countries represented 38.6% of total global salt imports by value.
Analyzing the distribution, the salt import market was less concentrated than exports. While the top five exporters accounted for 45.5% of total sales, the leading five importers represented a lower percentage at 38.6%, indicating a broader base of buyers worldwide.
By continent, 38.7% of imported salt was destined for Europe, followed by Asia (32.6%), North America (18.2%), Africa (5.6%), Latin America (3.7%, excluding Mexico but including the Caribbean), and Oceania (1%), with Australia and New Zealand being key importers.
For classification purposes, the six-digit Harmonized Tariff System (HTS) code for salt, including table salt, denatured salt, and pure sodium chloride, is 250100.

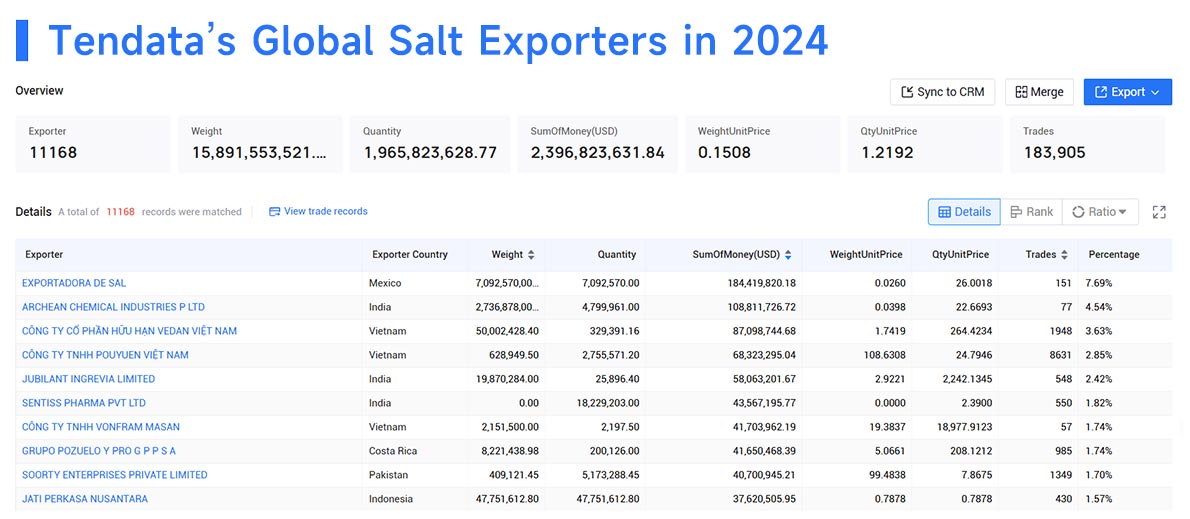
Top Salt Exports by Company in 2024
Data from Tendata, a global trade platform, highlights major salt exporters
1.EXPORTADORA DE SAL(7.69%, $184.42 Million)
2.ARCHEAN CHEMICAL INDUSTRIES P LTD(4.54%, $108.81 Million)
3.CÔNG TY CỔ PHẦN HỮU HẠN VEDAN VIỆT NAM(3.63%, $87.1 Million)
4.CÔNG TY TNHH POUYUEN VIỆT NAM(2.85%, $68.32 Million)
5.JUBILANT INGREVIA LIMITED(2.42%, $58.06 Million)
6.SENTISS PHARMA PVT LTD(1.82%, $43.57 Million)
7.CÔNG TY TNHH VONFRAM MASAN(1.74%, $41.7 Million)
8.GRUPO POZUELO Y PRO G P P S A(1.74%, $41.65 Million)
9.SOORTY ENTERPRISES PRIVATE LIMITED(1.7%, $40.7 Million)
10.JATI PERKASA NUSANTARA(1.57%, $37.62 Million)

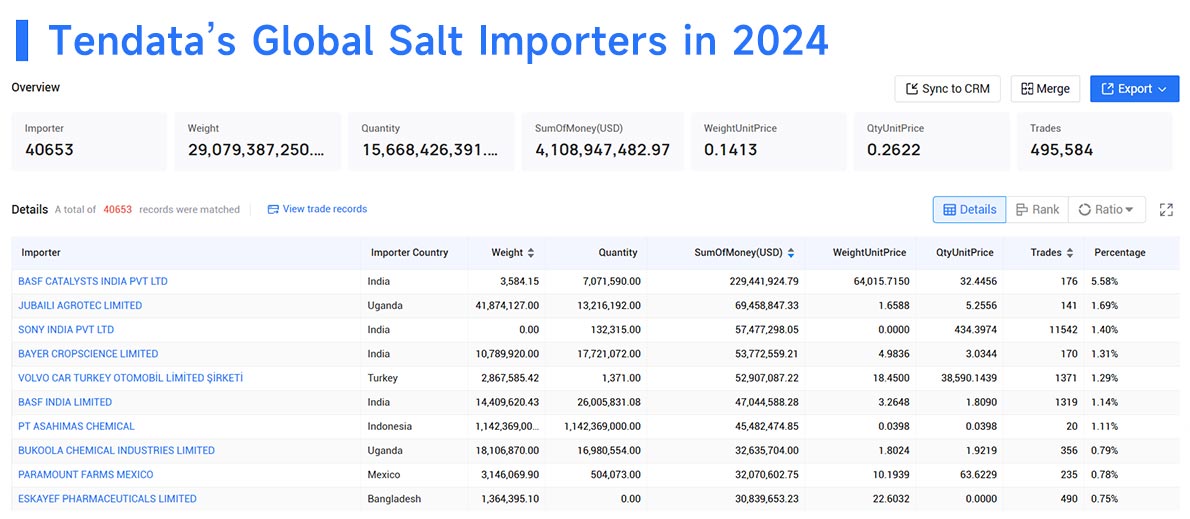
Top Salt Imports by Company in 2024
Data from Tendata, a global trade platform, highlights major salt importers
1.BASF CATALYSTS INDIA PVT LTD(5.58%, $229.44 Million)
2.JUBAILI AGROTEC LIMITED(1.69%, $69.46 Million)
3.SONY INDIA PVT LTD(1.4%, $57.48 Million)
4.BAYER CROPSCIENCE LIMITED(1.31%, $53.77 Million)
5.VOLVO CAR TURKEY OTOMOBİL LİMİTED ŞİRKETİ(1.29%, $52.91 Million)
6.BASF INDIA LIMITED(1.14%, $47.04 Million)
7.PT ASAHIMAS CHEMICAL(1.11%, $45.48 Million)
8.BUKOOLA CHEMICAL INDUSTRIES LIMITED(0.79%, $32.64 Million)
9.PARAMOUNT FARMS MEXICO(0.78%, $32.07 Million)
10.ESKAYEF PHARMACEUTICALS LIMITED(0.75%, $30.84 Million)

Leading Salt Exporters in 2023
Below are the 20 countries with the highest salt export values:
1.Netherlands: $403.1 million (11.9%)
2.Germany: $369.6 million (10.9%)
3.India: $333.4 million (9.8%)
4.United States: $258.2 million (7.6%)
5.Chile: $181.9 million (5.4%)
6.Spain: $162.5 million (4.8%)
7.Canada: $154.6 million (4.6%)
8.China: $130.2 million (3.8%)
9.Belgium: $127.4 million (3.8%)
10.United Kingdom: $84.1 million (2.5%)
11.Turkey: $71.9 million (2.1%)
12.Denmark: $71.7 million (2.1%)
13.France: $71.2 million (2.1%)
14.Egypt: $63.3 million (1.9%)
15.Pakistan: $52.7 million (1.6%)
16.Romania: $49 million (1.4%)
17.Poland: $48.1 million (1.4%)
18.Italy: $44.9 million (1.3%)
19.Kenya: $41.4 million (1.2%)
20.Bahamas: $38.7 million (1.1%)
These top 20 countries collectively accounted for 81.2% of all salt exports in 2023.
The fastest-growing exporters since 2022 included Turkey (+11.8%), Kenya (+9%), Denmark (+7.8%), and India (+6.9%). Conversely, countries that experienced declines included Pakistan (-23.9%), Canada (-20.5%), Romania (-16.7%), the United Kingdom (-11%), and China (-9%).
Top Salt Importing Countries in 2023
The global salt import market was valued at $5.16 billion, reflecting an 18.5% increase over the past five years but a 3.6% decline compared to 2022.
Leading salt-importing nations in 2023 included:
1.United States: $687.7 million (13.5%)
2.China: $453 million (8.9%)
3.Japan: $315.7 million (6.2%)
4.Germany: $257.4 million (5.1%)
5.South Korea: $247.3 million (4.9%)
6.Canada: $216.3 million (4.3%)
7.Belgium: $207.1 million (4.1%)
8.Taiwan: $147.9 million (2.9%)
9.United Kingdom: $136.2 million (2.7%)
10.Indonesia: $135.4 million (2.7%)
11.France: $135 million (2.7%)
12.Norway: $111.4 million (2.2%)
13.Ukraine: $109.5 million (2.2%)
14.taly: $85.7 million (1.7%)
15.Netherlands: $82.5 million (1.6%)
16.Czech Republic: $79.9 million (1.6%)
17.Brazil: $75.9 million (1.5%)
18.Poland: $67.7 million (1.3%)
19.Sweden: $65.8 million (1.3%)
20.Ireland: $64.3 million (1.3%)
These top 20 nations imported 72.5% of the world's total salt supply in 2023.
Fastest-growing importers included Canada (+42.1%), Ireland (+26.9%), the United Kingdom (+21.6%), and France (+20.1%). Countries with declining imports were China (-19.2%), the United States (-15.8%), Germany (-11.3%), Japan (-9.2%), and Sweden (-2.6%).
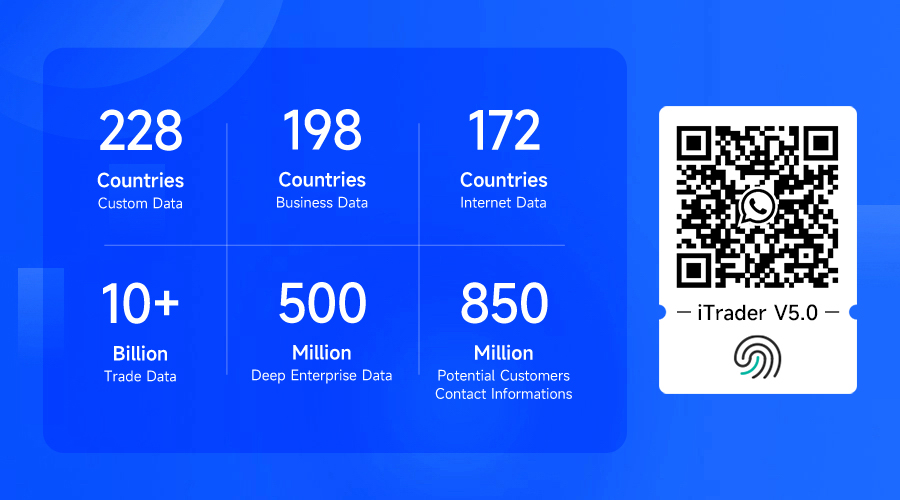
Trade Data: Tendata has accumulated 10 billion+ trade transaction details
from 228+ countries and regions, supporting one-click query of major import and
export countries, customer distribution, product volume and price, etc., which
helps import and export enterprises to accurately understand the global market
and the trade environment of the target market.
Business Data: Tendata has a total of 500 million+ in-depth enterprise data, involving 198 countries and 230+ industry segments, covering the current operation status, financial information, product information, business relationships, intellectual property rights, etc. The data is fine, which makes it easy to assess the real strength of the target customers in depth, and expand the potential customer base.
Internet Data: Tendata's total of 850 million+ contact data, integrating social media, Collingwood, emails and other multi-channel contacts, helps to reach key contacts of enterprises with one click and improve the efficiency of customer development, as well as news and public opinion monitoring, which helps to grasp the Internet information in a timely manner.

Category
Leave Message for Demo Request or Questions


 T-info
 T-discovery

 My
Tendata
 Market Analysis
 Customer
Development
 Competitor
Monitoring
 Customer Relationship


