 Market Insights
 22-01-2025
In 2023, the global trade value of fresh or chilled salmon shipped worldwide reached approximately $17.7 billion.
From 2019, when exports totaled $13.7 billion, the overall market value for fresh or chilled salmon increased by an average of 29.7%. Between 2022 and 2023, exports climbed 2.8%, rising from $17.2 billion.
The top five countries exporting fresh or chilled salmon were Norway, Sweden, Chile, the United Kingdom, and Canada. Together, these dominant suppliers accounted for 86.1% of global salmon export sales in 2023.
By continent, Europe led the market with $15.5 billion in fresh or chilled salmon exports, representing 87.8% of global sales. Latin American countries, including the Caribbean, held second place at 6.4%, followed by North America at 3.9%.
Smaller shares came from Oceania (primarily Australia) with 1.9%, Asia with 0.1%, and Africa contributing a mere 0.001%.
Salmon exports are classified into two main categories:
1. Atlantic or Danube salmon: $17.5 billion (99% of global sales)
2. Pacific salmon: $178.8 million (1%)
Turning to imports, the leading global buyers of fresh or chilled salmon in 2023 were Sweden, Poland, the United States, France, and mainland China. These five nations accounted for over 56.4% of worldwide salmon imports.
The concentration of top exporters is significantly higher than that of top importers, reflecting the larger number of importing regions. Approximately 145 countries, islands, and territories import salmon, compared to around 60 exporting entities.
For tariff classification, the 6-digit Harmonized Tariff System (HTS) code for fresh or chilled Atlantic and Danube salmon is 030214, while 030213 applies to fresh or chilled Pacific salmon.
Further data on prepared or preserved salmon, whether whole or in pieces, is detailed later. These items are classified under HTS code 160411.

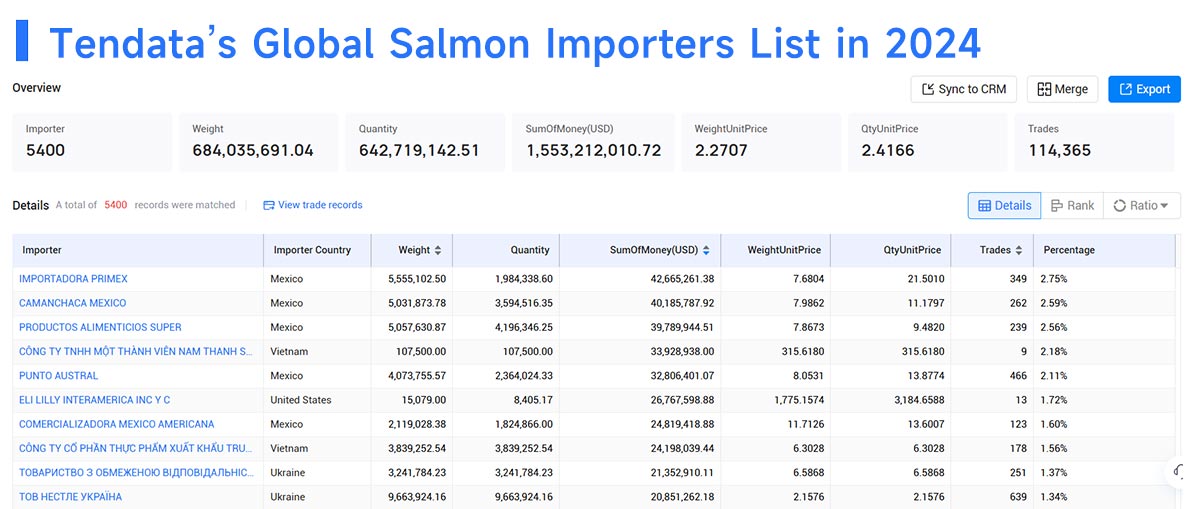
Major Salmon Importers in 2024
According to Tendata trade data, these companies were top importers:
1. IMPORTADORA PRIMEX (2.75%, $42.67 million)
2. CAMANCHACA MEXICO (2.59%, $40.19 million)
3. PRODUCTOS ALIMENTICIOS SUPER (2.56%, $39.79 million)
4. CÔNG TY TNHH MỘT THÀNH VIÊN NAM THANH SƠN (2.18%, $33.93 million)
5. PUNTO AUSTRAL (2.11%, $32.81 million)
6. ELI LILLY INTERAMERICA INC Y C (1.72%, $26.77 million)
7. COMERCIALIZADORA MEXICO AMERICANA (1.6%, $24.82 million)
8. CÔNG TY CỔ PHẦN THỰC PHẨM XUẤT KHẨU TRUNG SƠN HƯNG YÊN (1.56%, $24.2 million)
9. ТОВАРИСТВО З ОБМЕЖЕНОЮ ВІДПОВІДАЛЬНІСТЮ ЮНІВЕРСАЛ ФІШ КОМПАНІ (1.37%, $21.35 million)
10. ТОВ НЕСТЛЕ УКРАЇНА (1.34%, $20.85 million)
>>>Get A Free Demo from Tendata<<<

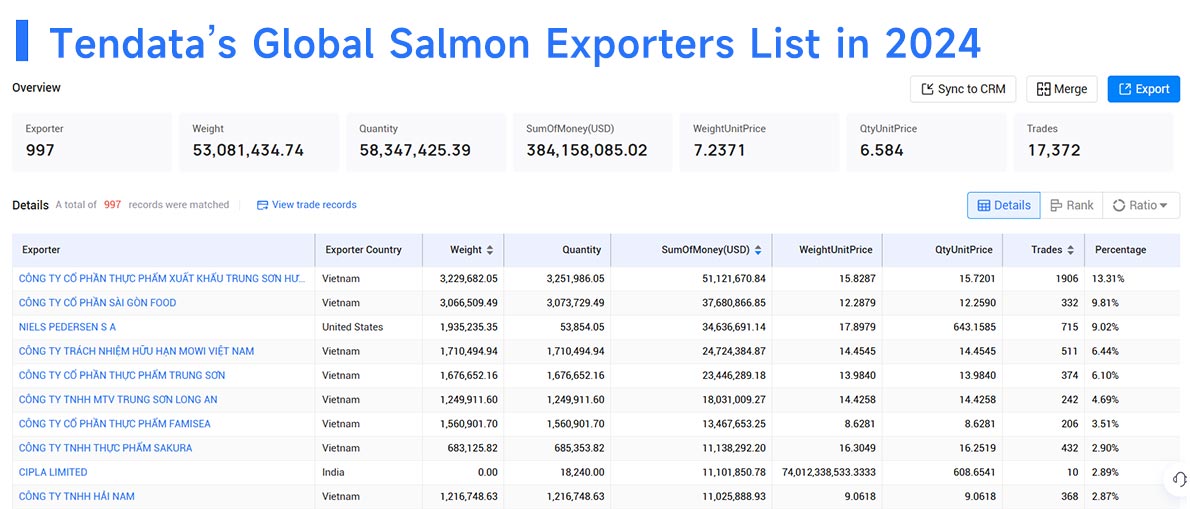
Major Salmon Exporters in 2024
Based on Tendata trade statistics, top exporting companies included:
1. CÔNG TY CỔ PHẦN THỰC PHẨM XUẤT KHẨU TRUNG SƠN HƯNG YÊN (13.31%, $51.12 million)
2. CÔNG TY CỔ PHẦN SÀI GÒN FOOD (9.81%, $37.68 million)
3. NIELS PEDERSEN S A (9.02%, $34.64 million)
4. CÔNG TY TRÁCH NHIỆM HỮU HẠN MOWI VIỆT NAM (6.44%, $24.72 million)
5. CÔNG TY CỔ PHẦN THỰC PHẨM TRUNG SƠN (6.1%, $23.45 million)
6. CÔNG TY TNHH MTV TRUNG SƠN LONG AN (4.69%, $18.03 million)
7. CÔNG TY CỔ PHẦN THỰC PHẨM FAMISEA (3.51%, $13.47 million)
8. CÔNG TY TNHH THỰC PHẨM SAKURA (2.9%, $11.14 million)
9. CIPLA LIMITED (2.89%, $11.1 million)
10. CÔNG TY TNHH HẢI NAM (2.87%, $11.03 million)
>>>Get A Free Demo from Tendata<<<

Top Countries for Fresh or Chilled Salmon Imports
From 2019 to 2023, worldwide salmon imports surged by 29.9%, reaching $17 billion. Year-on-year growth from 2022 was 3.8%.
1. Sweden: $4.2 billion (24.4% of total imports)
2. Poland: $1.7 billion (9.9%)
3. United States: $1.4 billion (8.4%)
4. France: $1.3 billion (7.4%)
5. China: $1.1 billion (6.3%)
6. Denmark: $971.5 million (5.7%)
7. Brazil: $764.7 million (4.5%)
8. Italy: $698.1 million (4.1%)
9. United Kingdom: $634 million (3.7%)
10. Spain: $549.1 million (3.2%)
11. Netherlands: $503.3 million (3%)
12. Germany: $397.9 million (2.3%)
13. Finland: $311.5 million (1.8%)
14. South Korea: $274.5 million (1.6%)
15. Lithuania: $250.8 million (1.5%)
These 15 countries together bought 87.8% of global salmon imports in 2023.
The fastest import growth since 2022 came from China (up 43.1%), Italy (up 18.1%), Poland (up 15%), and Sweden (up 7.9%). Declines were observed in Finland (-19.8%), Germany (-17.8%), Lithuania (-17.2%), and South Korea (-12.3%).
Leading Countries for Fresh or Chilled Salmon Exports
The following are the top 15 nations by export value for fresh or chilled salmon in 2023.
1. Norway: $8.6 billion (48.9% of global salmon exports)
2. Sweden: $4.1 billion (23.5%)
3. Chile: $1.1 billion (6.4%)
4. United Kingdom: $722 million (4.1%)
5. Canada: $580.7 million (3.3%)
6. Denmark: $577.1 million (3.3%)
7. Faroe Islands: $429.8 million (2.4%)
8. Australia: $262.9 million (1.5%)
9. Iceland: $207.2 million (1.2%)
10. Finland: $199.1 million (1.1%)
11. Switzerland: $187.7 million (1.1%)
12. Netherlands: $173.3 million (1%)
13. France: $164.2 million (0.9%)
14. United States: $100.9 million (0.6%)
15. New Zealand: $72.8 million (0.4%)
Together, these countries accounted for 99.5% of all fresh or chilled salmon exports in 2023.
Among these exporters, the fastest-growing countries since 2022 were France (up 26.1%), New Zealand (up 11.7%), Sweden (up 9.9%), Chile (up 8.5%), and Norway, the largest exporter, which saw a 5.5% increase.
Countries with significant declines included the United States (-43.1% from 2022), Iceland (-27.3%), Finland (-20%), Canada (-19.6%), and Faroe Islands (-14.4%).
Leading Exporters of Prepared or Preserved Salmon
In 2023, global exports of prepared or preserved salmon were valued at $964.9 million, reflecting a -6.6% decline from 2022 but an 11% rise since 2019. This segment accounted for 5.5% of total fresh and chilled salmon export value, up from 5.2% in 2022.
1. Germany: $255.5 million (26.5% of exports)
2. United States: $120.7 million (12.5%)
3. Japan: $103.2 million (10.7%)
4. Canada: $97.6 million (10.1%)
5. United Kingdom: $77.1 million (8%)
6. France: $41.2 million (4.3%)
7. Australia: $38.9 million (4%)
8. Belgium: $29.7 million (3.1%)
9. Italy: $29.7 million (3.1%)
10. Sweden: $21.4 million (2.2%)
11. Denmark: $16.7 million (1.7%)
12. Switzerland: $14.7 million (1.5%)
13. Taiwan: $13 million (1.4%)
14. Spain: $10 million (1%)
15. Netherlands: $9.2 million (1%)
These top exporters provided 91.1% of the world’s prepared or preserved salmon exports.
Spain showed the largest growth from 2022 (up 43.8%), followed by France (up 36.2%), Denmark (up 25%), and Belgium (up 11.1%). In contrast, sharp declines occurred in Netherlands (-26%), United States (-25.5%), Australia (-25.4%), United Kingdom (-19.1%), and Canada (-18.3%).
Main Importers of Prepared or Preserved Salmon
The 2023 global import value for prepared or preserved salmon matched its export total of $964.9 million, with a -6.6% decline from 2022 and an 11% increase since 2019. This segment made up 5.7% of total fresh and chilled salmon import value, lower than the 6.3% share in 2022.
1. Germany: $255.5 million (26.5%)
2. United States: $120.7 million (12.5%)
3. Japan: $103.2 million (10.7%)
4. Canada: $97.6 million (10.1%)
5. United Kingdom: $77.1 million (8%)
6. France: $41.2 million (4.3%)
7. Australia: $38.9 million (4%)
8. Belgium: $29.7 million (3.1%)
9. Italy: $29.7 million (3.1%)
10. Sweden: $21.4 million (2.2%)
11. Denmark: $16.7 million (1.7%)
12. Switzerland: $14.7 million (1.5%)
13. Taiwan: $13 million (1.4%)
14. Spain: $10 million (1%)
15. Netherlands: $9.2 million (1%)
Together, these importers accounted for 91.5% of global purchases of prepared or preserved salmon. Spain (up 43.8%), France (up 36.2%), and Denmark (up 25%) saw the highest growth, while major declines occurred in Netherlands (-26%), United States (-25.5%), Australia (-25.4%), and United Kingdom (-19.1%).
Category
Leave Message for Demo Request or Questions


 T-info
 T-discovery

 My
Tendata
 Market Analysis
 Customer
Development
 Competitor
Monitoring
 Customer Relationship


