 Market Insights
 25-11-2024
Leading Cranberry Export Overview
In 2023, global exports of cranberries amounted to a total of US$574.6 million. This figure reflects a decrease of -6.9% compared to 2019, when global cranberry exports were valued at $617 million. Year over year, the value of cranberry exports fell by -2.3% from $588.2 million in 2022.
Cranberries are known for their hard, sour, and bitter taste. Consequently, about 95% of cranberries are processed into products like cranberry juice or sauce. Cranberry juices are typically sweetened or blended with other fruit juices to reduce their tartness.
The top five cranberry exporters—United States, Canada, Netherlands, Chile, and Germany—accounted for 93.4% of all global cranberry exports in 2023.
From a continental perspective, North American countries led the cranberry export market in 2023, with shipments valued at $378.5 million, representing 65.9% of the global total. Europe was the second-largest exporter, contributing 27.3% to global exports. Smaller shares of cranberry exports came from Latin America (5.8%), Asia (1.1%), Oceania (0.03%), and Africa (0.01%).
Leading Cranberry Import Overview
In 2023, the top cranberry importers were the Netherlands, mainland China, Germany, Mexico, and Poland. These countries collectively accounted for about 49.6% of global cranberry imports.
The data indicate a more concentrated export market, with 60 exporters accounting for 93.4% of global sales, compared to nearly 140 importing countries, with the top five importers consuming roughly half (49.6%) of the total.
European countries imported the largest share of cranberries (53.4%) in 2023, followed by Asia (21.3%), North America (19.8%), Latin America (2.9%), Oceania (2%), and Africa (0.5%).
For research purposes, cranberries fall under the 6-digit Harmonized Tariff System code 200893, which includes prepared or preserved cranberries.

Top Cranberry Importing Companies
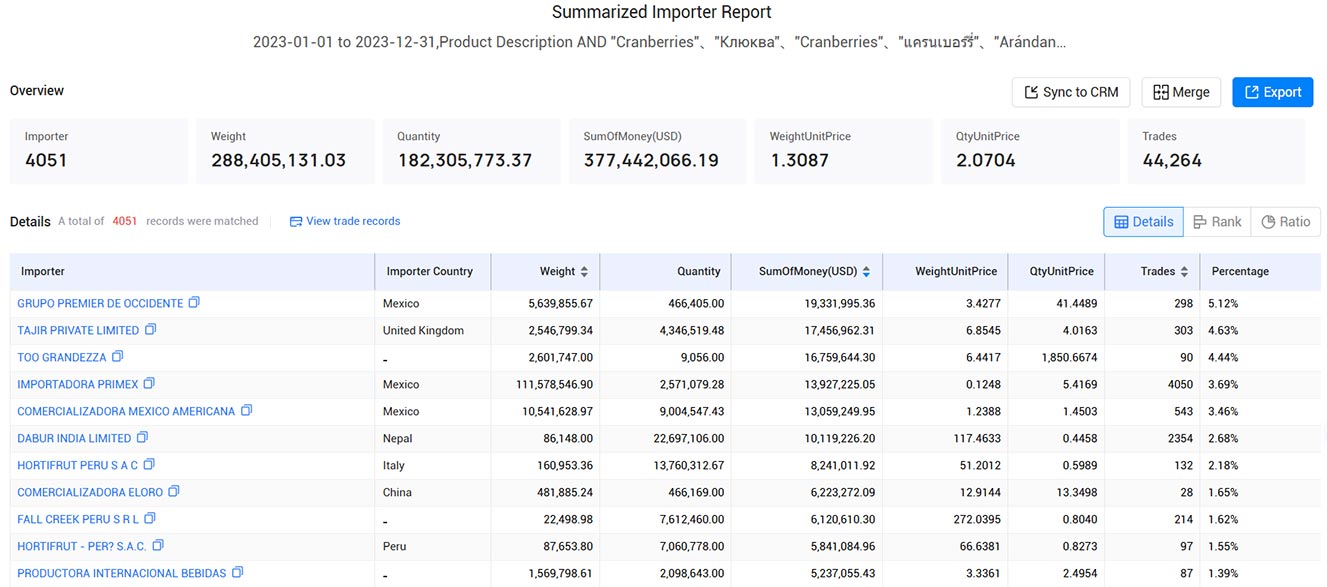
According to data provided by Tendata, the top cranberry importers in the world in 2023 are:
1.GRUPO PREMIER DE OCCIDENTE (5.12%, $19.33 Million)
2.TAJIR PRIVATE LIMITED (4.63%, $17.46 Million)
3.ТОО GRANDEZZA (4.44%, $16.76 Million)
4.IMPORTADORA PRIMEX (3.69%, $13.93 Million)
5.COMERCIALIZADORA MEXICO AMERICANA (3.46%, $13.06 Million)
6.DABUR INDIA LIMITED (2.68%, $10.12 Million)
7.HORTIFRUT PERU S A C (2.18%, $8.24 Million)
8.COMERCIALIZADORA ELORO (1.65%, $6.22 Million)
9.FALL CREEK PERU S R L (1.62%, $6.12 Million)
10.HORTIFRUT - PERU S.A.C. (1.55%, $5.84 Million)
>>Get A FREE DEMO From Tendata<<

Top Cranberry Exporting Companies
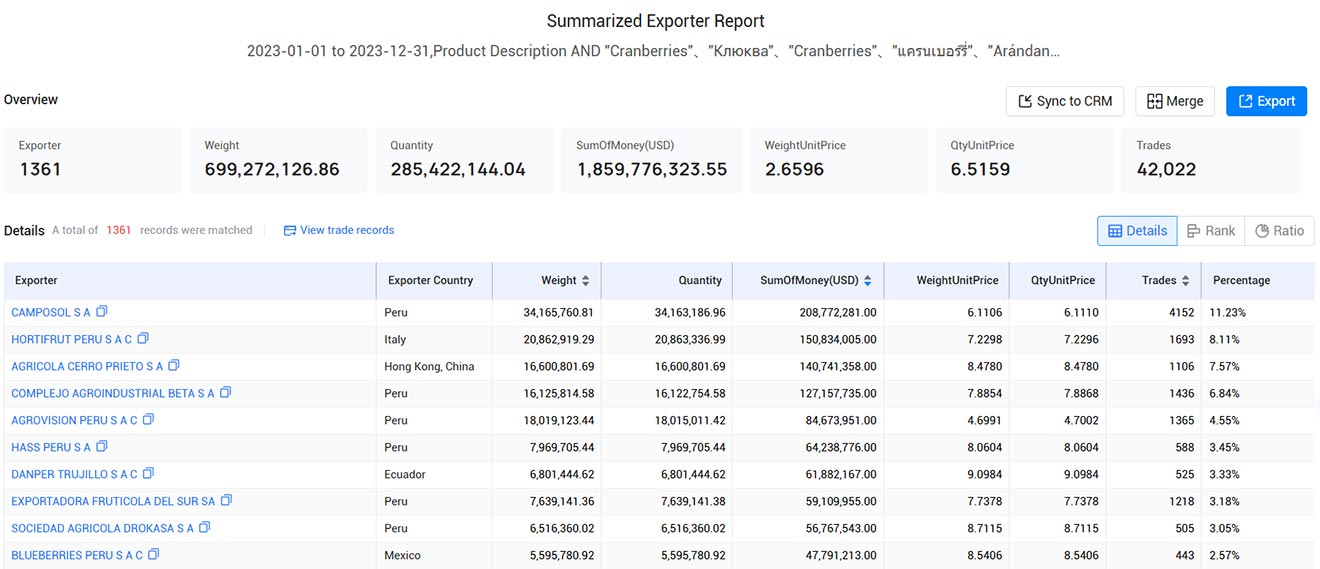
According to data provided by Tendata, the top cranberry exporters in the world in 2023 are:
1.CAMPOSOL S A (11.23%, $208.77 Million)
2.HORTIFRUT PERU S A C (8.11%, $150.83 Million)
3.AGRICOLA CERRO PRIETO S A (7.57%, $140.74 Million)
4.COMPLEJO AGROINDUSTRIAL BETA S A (6.84%, $127.16 Million)
5.AGROVISION PERU S A C (4.55%, $84.67 Million)
6.HASS PERU S A (3.45%, $64.24 Million)
7.DANPER TRUJILLO S A C (3.33%, $61.88 Million)
8.EXPORTADORA FRUTICOLA DEL SUR SA (3.18%, $59.11 Million)
9.SOCIEDAD AGRICOLA DROKASA S A (3.05%, $56.77 Million)
10.BLUEBERRIES PERU S A C (2.57%, $47.79 Million)
>>Find More Importers and Exporters through Tendata<<

Leading Cranberry Importing Countries
The cost of imported cranberries decreased by -2.7% over the five-year period starting in 2019 but grew by 2.4% since 2022.
Here are the 15 leading markets for cranberry imports in 2023:
1.Netherlands: US$98.1 million (17.4% of total imported cranberries)
2.Mainland China: $57.7 million (10.2%)
3.Germany: $43.8 million (7.7%)
4.Mexico: $43.4 million (7.7%)
5.Poland: $37.4 million (6.6%)
6.United States: $35.8 million (6.3%)
7.Canada: $32.9 million (5.8%)
8.United Kingdom: $21.8 million (3.9%)
9.France: $14.1 million (2.5%)
10.Spain: $12.3 million (2.2%)
11.South Korea: $11.8 million (2.1%)
12.Italy: $11.5 million (2%)
13.Taiwan: $10.5 million (1.9%)
14.India: $9.1 million (1.6%)
15.Australia: $7.2 million (1.3%)
These 15 countries accounted for nearly four-fifths (79.2%) of global cranberry imports in 2023.
The fastest-growing cranberry importers since 2022 include Mexico (up 66.4%), Italy (up 37.2%), mainland China (up 19.3%), and Germany (up 12%).
Top Cranberry Exporting Countries
Here are the top 15 cranberry exporting countries in 2023:
1.United States: US$267.2 million (46.5% of total exported cranberries)
2.Canada: $111.3 million (19.4%)
3.Netherlands: $97.6 million (17%)
4.Chile: $32.9 million (5.7%)
5.Germany: $27.9 million (4.8%)
6.Poland: $5.8 million (1%)
7.Spain: $4.2 million (0.7%)
8.United Kingdom: $3.4 million (0.6%)
9.Malaysia: $3.3 million (0.6%)
10.Slovakia: $2.7 million (0.5%)
11.Italy: $2.5 million (0.4%)
12.Austria: $2.4 million (0.4%)
13.Denmark: $2.3 million (0.4%)
14.Finland: $1.3 million (0.2%)
15.Estonia: $905,000 (0.2%)
These countries shipped 98.5% of globally exported cranberries in 2023.
The fastest-growing cranberry exporters since 2022 include Spain (up 509.9%), Slovakia (up 218.2%), Estonia (up 80.6%), and Italy (up 51.4%).
Major suppliers that saw declines in their cranberry exports include Malaysia (down -45.9%), Poland (down -44.3%), Canada (down -12.1%), Finland (down -8.2%), and the United States (down -4.9%).
Tendata Provides the Following Types of Customs Data:
1. Trade Data
Tendata offers over 10 billion trade records covering 218 countries and regions, accumulating detailed transaction details from over 2 billion trade transactions. This enables precise analysis of the distribution of global target import and export countries, details of import and export customs districts, and the market environment of target countries.
2. Business Data
Tendata's business data covers 198 countries and includes commercial databases for over 230 industries, with data on more than 210 million companies. It covers various aspects of enterprise operations, financial information, competitors, and senior executives. This finely detailed data facilitates in-depth evaluation of the true strength of target customers and expands potential customer base.
3. Cloud Search Data
Tendata's data covers 172 countries and includes contact information for over 700 million companies. In addition to basic information such as company names, official website links, product images, and contact persons, it also integrates information from platforms like LinkedIn and social media, helping foreign trade enterprises gain a panoramic understanding of customers and the market. Furthermore, real-time updated data enables companies to stay informed about market changes and respond promptly.


Category
Leave Message for Demo Request or Questions


 T-info
 T-discovery

 My
Tendata
 Market Analysis
 Customer
Development
 Competitor
Monitoring
 Customer Relationship


