 Market Insights
 22-08-2024
In 2023, global glass exports and glassware shipments reached a total value of approximately $90.8 billion.
This figure reflects an overall growth of 18.3% over the past five years, up from $76.8 billion in 2019. However, year over year, the export value of these products decreased by 2.7% from the $93.4 billion recorded in 2022.
Glass, primarily made from silica, is a versatile material known for its durability and transparency, though it can also be manufactured in various colors and textures. Products in this category include architectural glass, mirrors, stained glass, glass tiles, eyeglasses, and a wide range of household items like bottles, jars, and pitchers.
The 5 leading countries in glass exports in 2023 were mainland China, Germany, the United States, France, and Italy. Together, these countries accounted for over half (51.9%) of the global glass exports market for these products.
Regionally, Asia was the top exporter of glass and glassware in 2023, with shipments totaling $41.6 billion, or 45.8% of the global total. Europe followed closely behind, contributing 41.4% to the global glass exports, while North American exporters made up 10.2%. The remaining portions were distributed among Africa (1.24%), Latin America (1.21%, excluding Mexico but including the Caribbean), and Oceania (0.1%), primarily driven by Australia and New Zealand.

Key Categories of Glass Exports
For those researching trade data, the 2-digit Harmonized Tariff System (HTS) code for glass exports and glassware is 70. The major categories of glass exports include:
· Glass containers (bottles, jars, etc.): 17.7% of total exports
· Glass fibers and glass wool: 14.6%
· Tempered and laminated safety glass: 14.5%
· Tableware, kitchenware, and indoor glass décor: 12%
· Glass mirrors: 9.7%
· Float glass and polished glass: 7.1%
· Miscellaneous glass items: 4.1%
· Sheet glass: 3.8%
· Cast and rolled glass: 3.3%
· Insulating glass units: 2.8%
· Glass beads and imitation jewelry: 2.6%
· Laboratory and pharmaceutical glassware: 1.5%
These subcategories together accounted for 93.7% of the global glass exports sales in 2023.
Leading Exporters of Glass Exports and Glassware
Here are the top 15 countries by the value of glass exports and glassware in 2023:
1. Mainland China: $25.6 billion (28.2% of global glass exports)
2. Germany: $8.4 billion (9.2%)
3. United States: $6.2 billion (6.8%)
4. France: $3.7 billion (4%)
5. Italy: $3.3 billion (3.7%)
6. Poland: $3 billion (3.3%)
7. Belgium: $2.7 billion (3%)
8. Japan: $2.6 billion (2.9%)
9. Czech Republic: $2.42 billion (2.7%)
10. Mexico: $2.38 billion (2.6%)
11. Hong Kong: $1.97 billion (2.2%)
12. South Korea: $1.9 billion (2.1%)
13. Spain: $1.87 billion (2.1%)
14. Türkiye: $1.65 billion (1.8%)
15. Netherlands: $1.64 billion (1.8%)
These 15 countries accounted for 76.3% of the global glass exports in 2023.
Among these exporters, the fastest-growing markets since 2022 were Poland (up 7.3%), Belgium (up 6.5%), Germany (up 3.3%), and Italy (up 3%). Conversely, several exporters saw a decline in their glass exports sales, including Hong Kong (down 16.9%), Japan (down 10.1%), South Korea (down 8.2%), mainland China (down 4%), and Mexico (down 3%).
Glass-Related Export Companies
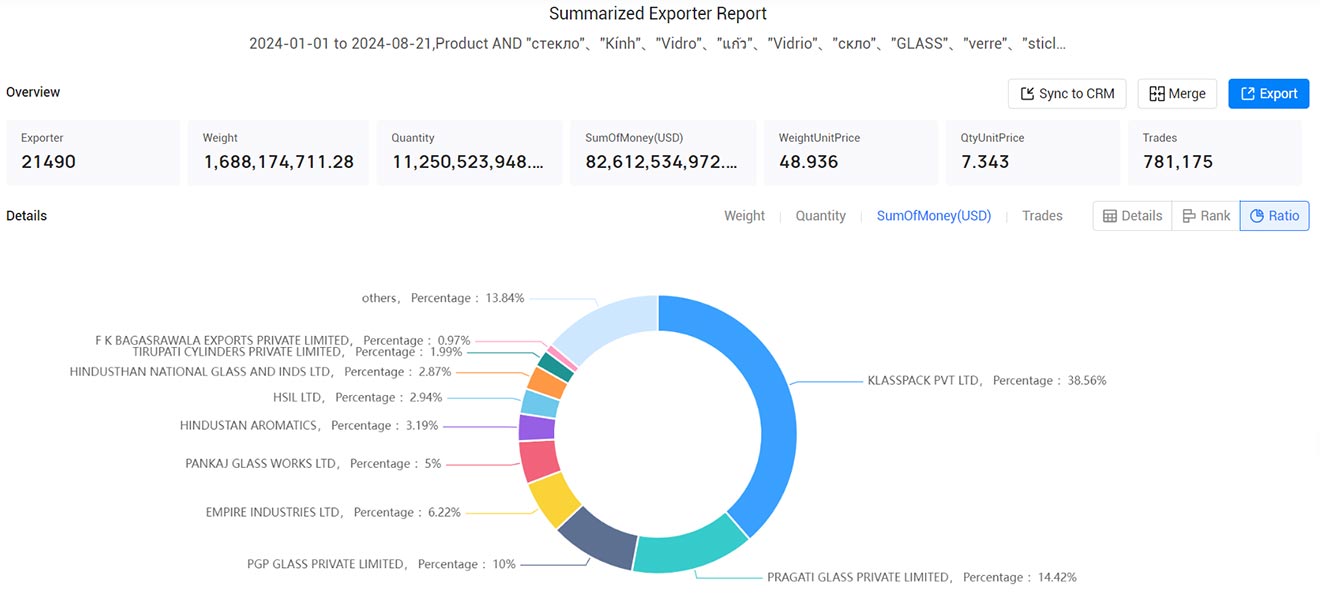
Based on data from global trading platform Tendata, the following companies are prominent players in the international glass exports trade:
1. Klasspack Pvt Ltd: 38.56%, $31,858.05 million
2. Pragati Glass Private Limited: 14.42%, $11,909.45 million
3. PGP Glass Private Limited: 10%, $8,262.37 million
4. Empire Industries Ltd: 6.22%, $5,139.34 million
5. Pankaj Glass Works Ltd: 4.99%, $4,125.81 million
6. Hindustan Aromatics: 3.19%, $2,637.67 million
7. HSIL Ltd: 2.93%, $2,424.65 million
8. Hindusthan National Glass and Industries Ltd: 2.87%, $2,372.51 million
9. Tirupati Cylinders Private Limited: 1.99%, $1,644.61 million
10. F K Bagasrawala Exports Private Limited: 0.97%, $801.87 million
These companies illustrate the significant global demand for glass exports and related products, driven by diverse industrial and consumer applications.

>>>Click to Get Free Access to Customs Data from 90+ Countries<<<
Is Free Customs Data Useful?
Currently, customs data in the market is divided into two categories: paid and free. According to Tendata's knowledge, many customs data companies claim to have developed a free customs data system. However, the core intention is to attract traffic for secondary marketing and profit.

Shanghai Tendata iTrader provides detailed customs data inquiries from 90+ countries, (>>>Click to Use Data Analytics for Free Online) statistical data inquiries from 27 EU countries, millions of genuine and accurate purchaser information, and detailed information on successful client bill of ladings. With its system capable of generating 17 types of market data analysis reports with a single click, Tendata iTrader assists management in making informed decisions effortlessly.
Category
Leave Message for Demo Request or Questions


 T-info
 T-discovery

 My
Tendata
 Market Analysis
 Customer
Development
 Competitor
Monitoring
 Customer Relationship


