 Market Insights
 12-08-2024
In 2022, global black pepper exports amounted to a total of US$2.1 billion.
Since 2018, the overall value of exported black pepper has grown by an average of 12.8%, increasing from $1.84 billion in that year. However, on a year-over-year basis, the revenue from black pepper exports saw a decrease of 5.5% compared to the $2.2 billion recorded in 2021.
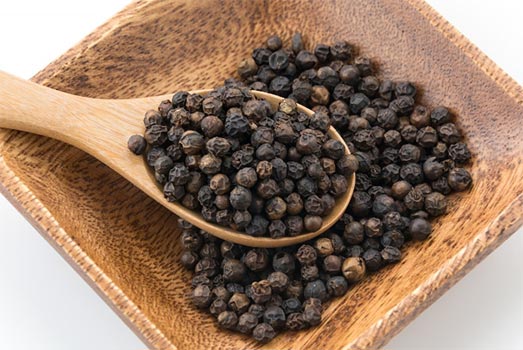
Black pepper is the most traded spice worldwide by volume. It is commonly used as a seasoning on dining tables, often paired with salt in shakers or mills.
The top 5 exporters of black pepper by value in 2022 were Vietnam, Brazil, Indonesia, India, and Sri Lanka. Together, these leading suppliers accounted for nearly 74% of all black pepper exported globally.
On the import side, the five largest importers in 2022 were the United States, India, Germany, Vietnam, and Japan. These top importers collectively represented nearly 48.2% of the total global import value for black pepper.
These figures indicate that the group of over 125 countries exporting black pepper is more concentrated, with the top five exporters covering 74% of the market. In contrast, the 200+ countries, territories, and islands involved in importing black pepper saw the top five importers account for a smaller share, at 48.2%.
From a continental standpoint, Asia led the way in black pepper exports in 2022, with shipments worth $1.4 billion, representing 65.6% of the global total. Latin America, excluding Mexico but including the Caribbean, followed with 15.4%, while Europe accounted for 13.8%. Smaller contributions came from North America (3.2%), Africa (1.9%), and Oceania (0.1%), with Australia and New Zealand leading in this region.
Regarding global black pepper imports, 35.7% of the spice was imported by Asian countries, followed by Europe (29.1%). Other import percentages included North America (25.7%), Africa (5.8%), Latin America (2.2%) excluding Mexico but including the Caribbean, and Oceania (1.4%), led by Australia and New Zealand.
For those conducting trade research, the 6-digit Harmonized Tariff System codes for black pepper are 090411 for unprocessed black pepper and 090412 for crushed or ground black pepper.
Breaking down these categories, 73.6% of global black pepper exports by value were for raw black pepper, while the remaining 26.4% were for crushed or ground black pepper.

Leading Black Pepper Exporters by Country
Below are the top 20 countries that exported the highest dollar value of black pepper in 2022, regardless of whether the black pepper was crushed, ground, or raw:
1. Vietnam: US$903.6 million (43.6% of total black pepper exports)
2. Brazil: $309.3 million (14.9%)
3. Indonesia: $148.1 million (7.1%)
4. India: $96.8 million (4.7%)
5. Sri Lanka: $75.9 million (3.7%)
6. Germany: $75.9 million (3.7%)
7. Netherlands: $60.1 million (2.9%)
8. United States: $48.1 million (2.3%)
9. Malaysia: $41.3 million (2%)
10. France: $31.4 million (1.5%)
11. Cambodia: $22.3 million (1.1%)
12. Austria: $21.2 million (1%)
13. China: $20.6 million (1%)
14. United Arab Emirates: $18.6 million (0.9%)
15. Spain: $16.6 million (0.8%)
16. Poland: $12.9 million (0.6%)
17. South Africa: $12.3 million (0.6%)
18. Mexico: $11.3 million (0.5%)
19. Belgium: $10.7 million (0.5%)
20. Italy: $9.3 million (0.5%)
These 20 countries collectively accounted for 93.9% of the world's black pepper exports in 2022.
Among the top exporters, the Netherlands (up 37.1%), the United States (up 17.1%), Mexico (up 13.6%), and Poland (up 13.5%) saw the fastest growth in black pepper exports since 2021.
Conversely, some countries experienced declines in their black pepper export revenues, with the United Arab Emirates (down -77.5% from 2021), Sri Lanka (down -37.9%), South Africa (down -24.2%), Cambodia (down -16.1%), and France (down -14.6%) leading the list.
Leading Black Pepper Importers by Country
In 2022, global imports of black pepper totaled $2.1 billion, representing a 48.2% increase over the five-year period starting from $1.7 billion in 2018, with a more modest 3.8% increase since 2021.
Here are the top 20 countries by the highest dollar value of black pepper imports in 2022, covering all forms of black pepper:
1. United States: US$466.9 million (22.4% of total black pepper imports)
2. India: $203.2 million (9.7%)
3. Germany: $138.6 million (6.6%)
4. Vietnam: $120 million (5.8%)
5. Japan: $77 million (3.7%)
6. United Kingdom: $69.5 million (3.3%)
7. France: $65.8 million (3.2%)
8. Netherlands: $63.2 million (3%)
9. Canada: $54 million (2.6%)
10. Egypt: $46.3 million (2.2%)
11. United Arab Emirates: $45.1 million (2.2%)
12. China: $42.3 million (2%)
13. Poland: $37.8 million (1.8%)
14. South Korea: $35.4 million (1.7%)
15. Thailand: $34.9 million (1.7%)
16. Pakistan: $28.92 million (1.4%)
17. Philippines: $27.61 million (1.3%)
18. Morocco: $27.5 million (1.3%)
19. Italy: $25.4 million (1.2%)
20. Australia: $23.6 million (1.1%)
These 20 countries collectively imported 78.3% of the world’s black pepper in 2022.
The fastest-growing markets for imported black pepper among these countries were Morocco (up 70% from 2021), Vietnam (up 54.1%), Japan (up 47.5%), and the United States (up 22.9%).
Conversely, several countries saw declines in their black pepper imports, including the United Arab Emirates (down -53.3% from 2021), Pakistan (down -39.4%), China (down -22%), France (down -0.9%), and Germany (down -0.3%).
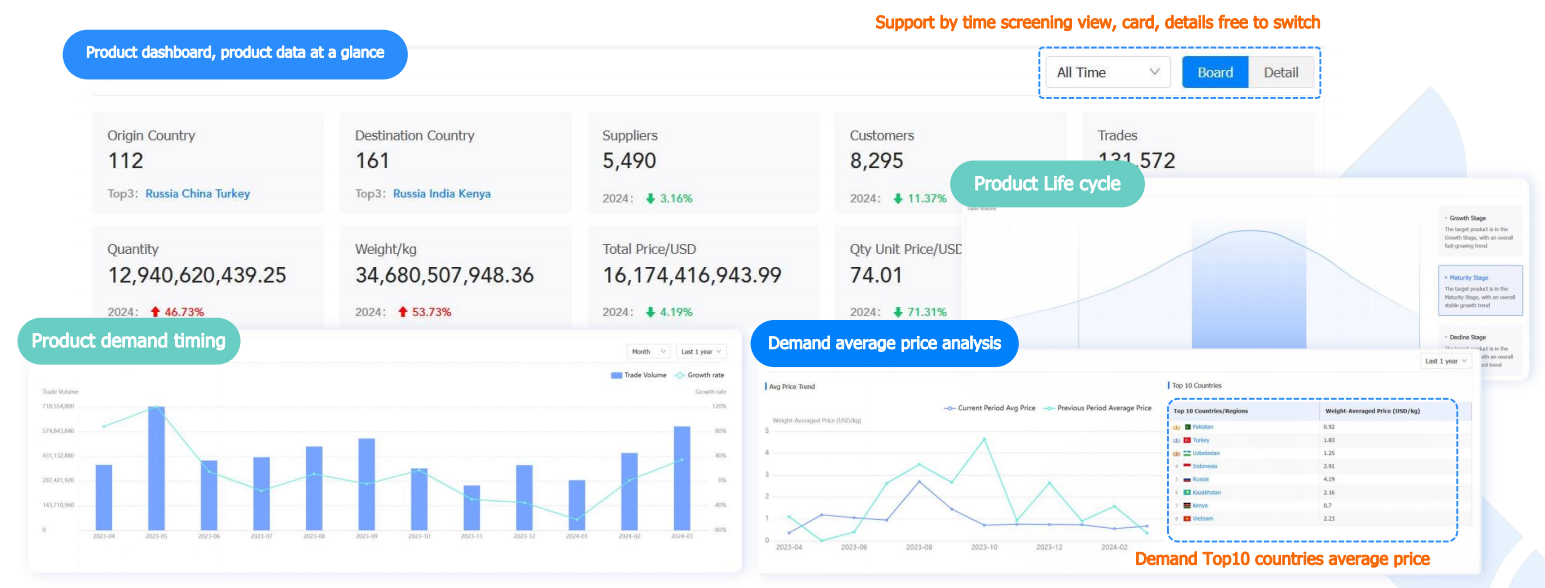
360° Product Intelligent Analysis Provides You with Insights into Performance Growth
Utilizing Tendata's dashboard, which displays data on the number of origin countries, destination countries, customers, suppliers, etc., helps enterprises comprehend the global trade overview of products. Through multi-dimensional intelligent analysis, including product life cycle, average price analysis, and product supply time, it assists enterprises in predicting future performance growth points.
There's no need for manual analysis of the product overview; dynamic monitoring of volume and price uncovers potential growth points at a glance.

Category
Leave Message for Demo Request or Questions


 T-info
 T-discovery

 My
Tendata
 Market Analysis
 Customer
Development
 Competitor
Monitoring
 Customer Relationship


