 Market Insights
 12-08-2024
As the most widely used cooking oil globally, the total expenditure on imported palm oil reached US$59 billion in 2022.
The global value of imported palm oil surged by 87.4% for all importing nations since 2018, when international purchases were valued at $31.5 billion.
Year-on-year, the worldwide import of imported palm oil saw a 14.7% increase, rising from $51.4 billion in 2021.
Palm oil, an edible vegetable oil derived from the reddish pulp of the oil palm fruit, is known for its high saturation of vegetable fat, making it a cost-effective option for cooking, blending into mayonnaise, and as a substitute for butter. Additionally, imported palm oil is a key component in the production of biodiesel fuels.
The top five importers of imported palm oil are India, China, Pakistan, the United States, and the Netherlands. Together, these major buyers accounted for 44.1% of the total imported palm oil globally in 2022.
From a regional perspective, Asian countries led in imported palm oil in 2022, with purchases totaling $35.2 billion, or nearly 59.7% of the global total. European countries followed, accounting for 19.8% of imported palm oil, while 12.7% of the world’s imported palm oil was destined for African buyers.
Smaller proportions of imported palm oil went to North America (5.1%), Latin America (2.3%) excluding Mexico but including the Caribbean, and Oceania (0.4%), with Australia, Papua New Guinea, and New Zealand leading the way.
For those researching trade, the Harmonized Tariff System code for imported palm oil and its derivatives, whether refined or not, is 1511.

Leading Countries in Palm Oil Imports
Below are the 15 countries that spent the most on imported palm oil during 2022:
1. India: US$11.7 billion (19.9% of total imported palm oil)
2. China: $5.8 billion (9.9%)
3. Pakistan: $3.9 billion (6.5%)
4. United States: $2.4 billion (4.1%)
5. Netherlands: $2.1 billion (3.6%)
6. Italy: $1.8 billion (3.1%)
7. Bangladesh: $1.77 billion (3%)
8. Malaysia: $1.46 billion (2.5%)
9. Spain: $1.39 billion (2.3%)
10. Philippines: $1.32 billion (2.2%)
11. Russia: $1.27 billion (2.2%)
12. Türkiye: $1.21 billion (2%)
13. Germany: $1.17 billion (2%)
14. Egypt: $1.13 billion (1.9%)
15. Vietnam: $1.11 billion (1.9%)
These 15 countries combined accounted for 67.2% of all imported palm oil in 2022.
Among these nations, the fastest-growing markets for imported palm oil since 2021 were the Philippines (up 121.1%), Germany (up 51.9%), Türkiye (up 51.1%), and the United States (up 35.9%).
On the other hand, a few major importing countries saw declines in their imported palm oil purchases, notably Spain (down 9.3% from 2021) and China (down 1.7%).
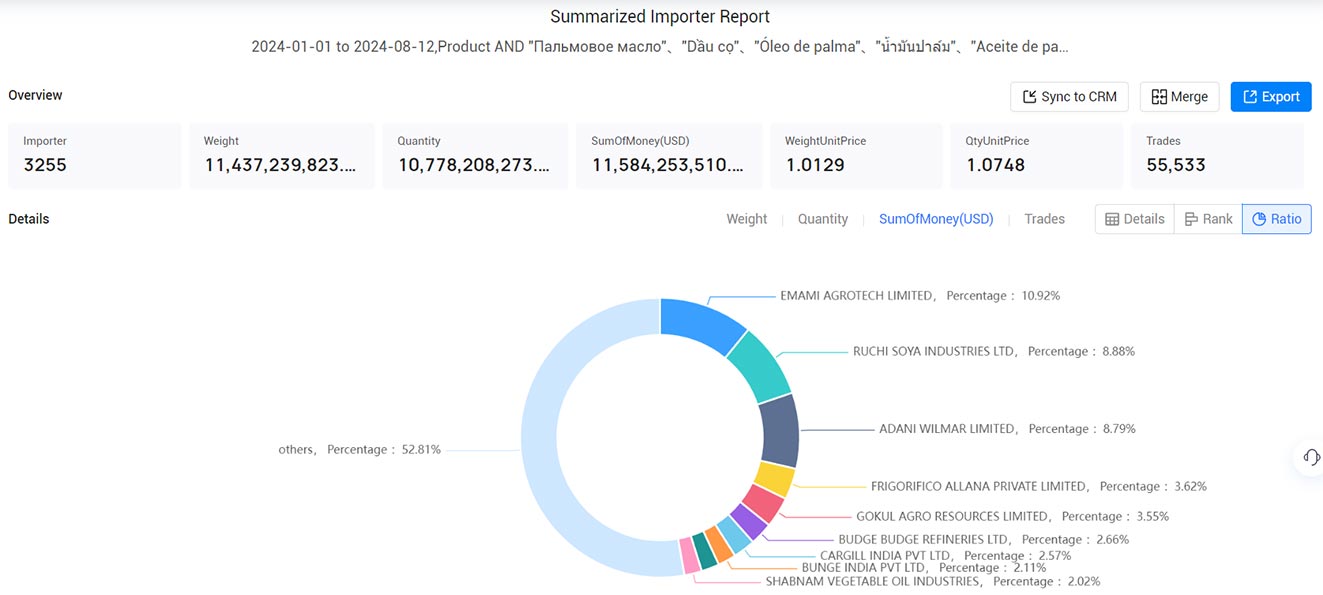
Palm Oil Imports by Companies in 2024
Here are some of the top companies involved in imported palm oil in 2024:
1. EMAMI AGROTECH LIMITED (10.92%, $1264.81 Million)
2. RUCHI SOYA INDUSTRIES LTD (8.88%, $1029.05 Million)
3. ADANI WILMAR LIMITED (8.79%, $1018.49 Million)
4. FRIGORIFICO ALLANA PRIVATE LIMITED (3.61%, $418.68 Million)
5. GOKUL AGRO RESOURCES LIMITED (3.55%, $411.62 Million)
6. BUDGE BUDGE REFINERIES LTD (2.66%, $308.01 Million)
7. CARGILL INDIA PVT LTD (2.57%, $297.53 Million)
8. BUNGE INDIA PVT LTD (2.11%, $244.71 Million)
9. K T V HEALTH FOOD PVT LTD (2.07%, $239.9 Million)
10. SHABNAM VEGETABLE OIL INDUSTRIES (2.02%, $234.09 Million)

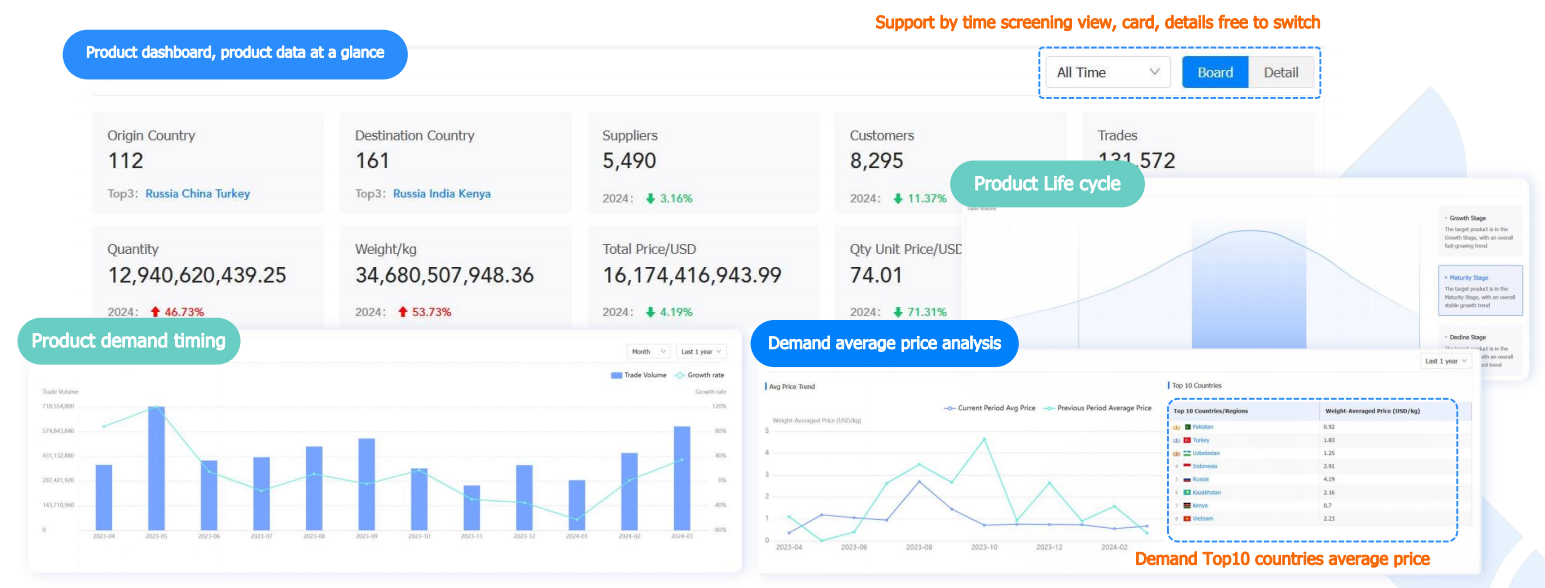
360° Product Intelligent Analysis Provides You with Insights into Performance Growth
Utilizing Tendata's dashboard, which displays data on the number of origin countries, destination countries, customers, suppliers, etc., helps enterprises comprehend the global trade overview of products. Through multi-dimensional intelligent analysis, including product life cycle, average price analysis, and product supply time, it assists enterprises in predicting future performance growth points.
There's no need for manual analysis of the product overview; dynamic monitoring of volume and price uncovers potential growth points at a glance.

Category
Leave Message for Demo Request or Questions


 T-info
 T-discovery

 My
Tendata
 Market Analysis
 Customer
Development
 Competitor
Monitoring
 Customer Relationship


