 Market Insights
 24-07-2024
In 2022, the global expenditure on imported pumpkins reached a total of US$1.71 billion.
This represents a significant increase of 21.7% in the overall cost of pumpkin imports since 2018, when the international market for pumpkins was valued at $1.4 billion.
Comparing year-over-year data, the imports of pumpkins grew by 6.1%, up from $1.61 billion in 2021.
In 2022, European countries dominated the pumpkin import market, accounting for nearly three-fifths (57.9%) of the global spending on imported pumpkins, which amounted to $989.4 million. North American importers followed, making up 31.9% of the total, while Asian countries received 9.5% of the world's imported pumpkins.
Smaller portions of pumpkin imports were distributed to other regions: Africa received 0.2%, Latin America (excluding Mexico but including the Caribbean) accounted for 0.4%, and Oceania (led by New Zealand) had 0.1%.
For research and classification purposes, the 6-digit Harmonized Tariff System code for fresh or chilled pumpkins and similar squash and gourds is 070993.

Leading Countries in Pumpkin Imports
The following 15 countries were the top spenders on imported pumpkins in 2022:
1. United States: US$481 million (28.1% of total imported pumpkins)
2. France: $203.3 million (11.9%)
3. Germany: $195.1 million (11.4%)
4. United Kingdom: $106.5 million (6.2%)
5. Netherlands: $99.3 million (5.8%)
6. Japan: $68.3 million (4%)
7. Canada: $60.5 million (3.5%)
8. Italy: $43.9 million (2.6%)
9. Belgium: $38.3 million (2.2%)
10. Switzerland: $36.4 million (2.1%)
11. Poland: $35.5 million (2.1%)
12. Austria: $34.4 million (2%)
13. Russia: $33.2 million (1.9%)
14. Spain: $23.8 million (1.4%)
15. Singapore: $22.5 million (1.3%)
These 15 countries collectively purchased 86.7% of all pumpkins imported in 2022.
Fastest-Growing Pumpkin Markets
Among the leading importers, the fastest-growing markets for pumpkins since 2018 were:
1. Switzerland: Up by 1,124%
2. Italy: Up by 80.9%
3. Poland: Up by 68.7%
4. Netherlands: Up by 53.1%
On the other hand, Japan was the only major market to record a decline in pumpkin imports, experiencing a decrease of 12.1% from 2021.
Major Pumpkin Importers in 2023
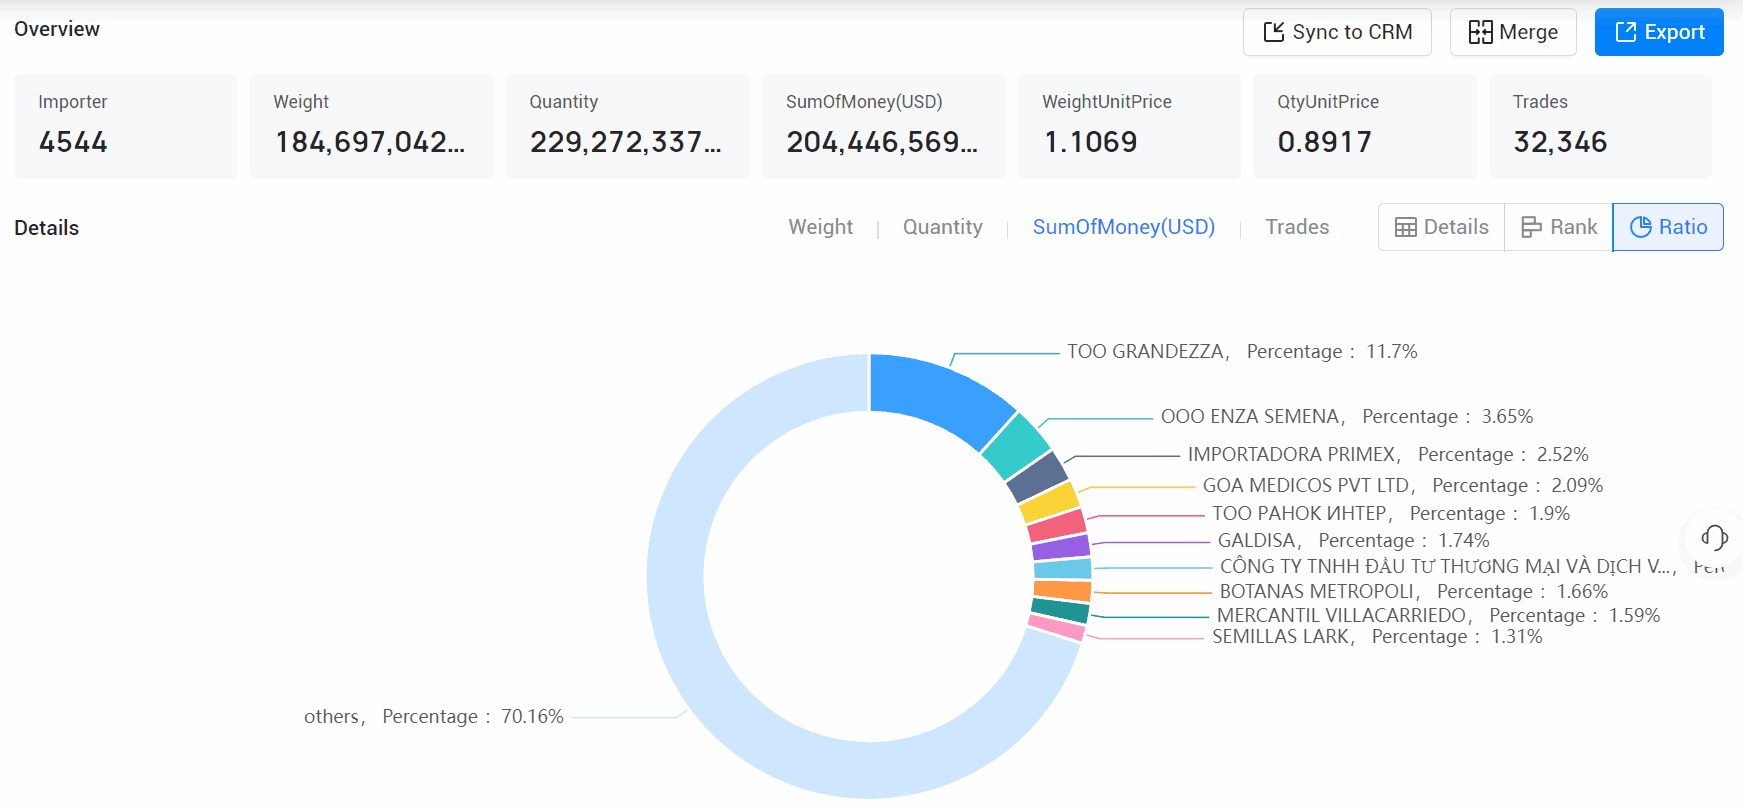
The following companies were the top pumpkin importers in 2023:
1. ТОО GRANDEZZA: 11.7%, $23.92 million
2. OOO ENZA SEMENA: 3.65%, $7.46 million
3. IMPORTADORA PRIMEX: 2.52%, $5.16 million
4. GOA MEDICOS PVT LTD: 2.09%, $4.26 million
5. ТОО РАНОК ИНТЕР: 1.9%, $3.88 million
6. GALDISA: 1.74%, $3.56 million
7. CÔNG TY TNHH ĐẦU TƯ THƯƠNG MẠI VÀ DỊCH VỤ TRUNG ĐÔNG: 1.68%, $3.44 million
8. BOTANAS METROPOLI: 1.67%, $3.4 million
9. MERCANTIL VILLACARRIEDO: 1.59%, $3.26 million
10. SEMILLAS LARK: 1.31%, $2.67 million
These companies played significant roles in the international pumpkin trade, contributing to the overall growth and distribution of pumpkins worldwide.

Retrieve Global Trade Data and Monitor Market Trends
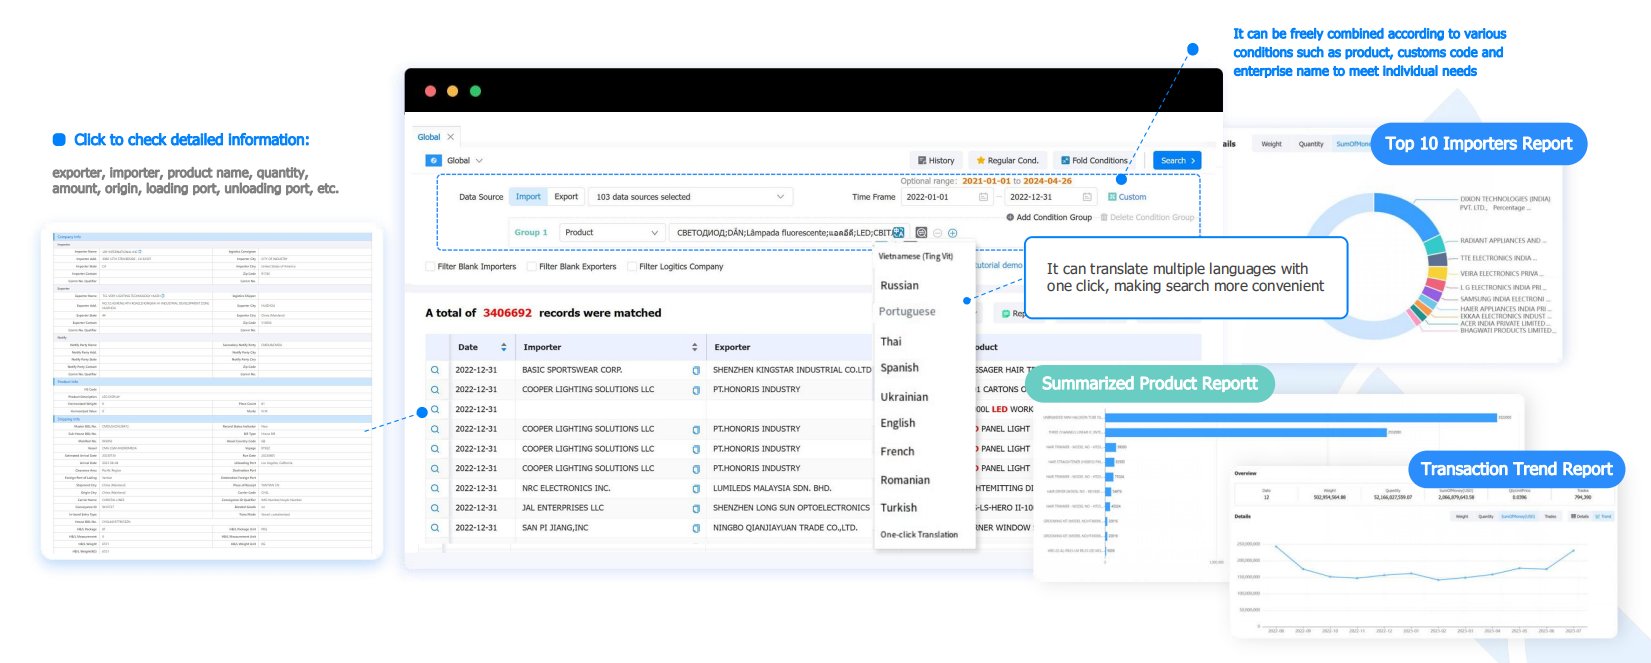
Tendata support one-click queries to track the global transaction details of specific products. Reflect the purchasing and supply activities throughout the entire supply chain and comprehensively display the state of the entire trade network.
Based on the statistical analysis of transaction data, view industry and product market trends to help businesses gain insights into market changes.
Tendata provides real-time, accurate, and detailed customs data, presenting the specifics of each transaction. Customized search criteria meet various filtering needs.

Category
Leave Message for Demo Request or Questions


 T-info
 T-discovery

 My
Tendata
 Market Analysis
 Customer
Development
 Competitor
Monitoring
 Customer Relationship


