 Market Insights
 23-07-2024
In 2022, global sales of exported fresh chicken reached US$8.9 billion, while exported frozen chicken achieved higher international sales at $22.4 billion.
The value of fresh chicken exports by country has increased by an average of 32% since 2018, when fresh chicken meat shipments were valued at $6.7 billion. Comparatively, total frozen chicken meat shipments have appreciated by 36.4%, up from $16.4 billion over the same five-year period.
By value, the five largest exporters of fresh chicken are Poland, Netherlands, United States of America, Belgium, and Germany. These leading nations accounted for approximately 72.1% of fresh poultry exports worldwide.
Exports of frozen poultry are slightly more concentrated. The top five shippers—Brazil, United States of America, Netherlands, Thailand, and Poland—generated 72.9% of globally exported frozen chicken meat in 2022.

Trade Codes and Market Shares
Six-digit Harmonized Tariff System (HTS) code prefixes relevant to chicken exports are:
- 020711 for whole fresh or chilled chicken
- 020713 for fresh or chilled chicken cuts and offal
- 020712 for whole frozen chicken
- 020714 for frozen chicken cuts and offal
In 2018, 70.9% of chicken shipments were frozen, compared to 29.1% for fresh poultry meat. By 2022, the share of frozen poultry shipments had risen to 71.5%, while exports of fresh chicken had fallen to 28.5%.
Fresh Chicken Exports by Country
Here are the 15 countries that exported the highest dollar value of fresh or chilled chicken in 2022, including both cut and whole fresh chicken:
1. Poland: $2.3 billion (26.2% of total fresh poultry exports)
2. Netherlands: $1.8 billion (20.2%)
3. United States: $909.3 million (10.2%)
4. Belgium: $851.2 million (9.6%)
5. Germany: $527 million (5.9%)
6. China: $294.9 million (3.3%)
7. France: $245 million (2.8%)
8. Austria: $212.6 million (2.4%)
9. Italy: $203.7 million (2.3%)
10. Hungary: $194.4 million (2.2%)
11. Spain: $183.7 million (2.1%)
12. Romania: $160.3 million (1.8%)
13. Ukraine: $126.2 million (1.4%)
14. United Kingdom: $97 million (1.1%)
15. Canada: $71.6 million (0.8%)
Together, these countries produced 92.3% of fresh chicken exports in 2022.
Growth Trends in Fresh Chicken Exports
Among the top exporters, the fastest-growing suppliers of fresh poultry since 2018 were:
- Poland (up 79.4%)
- United States (up 67.6%)
- Hungary (up 48.9%)
- Romania (up 46.2%)
There were declines in fresh poultry exports for:
- Ukraine (down 9.3% from 2018)
- United Kingdom (down 8.5%)
Frozen Chicken Exports by Country
The leaders in fresh chicken exports—Netherlands, Poland, and the United States—also appear among the major exporters of frozen chicken, although they trail behind Brazil in international sales of frozen poultry.
Here are the 15 countries that exported the highest dollar value of frozen chicken in 2022:
1. Brazil: $8.7 billion (38.9% of total frozen poultry)
2. United States: $4.1 billion (18.2%)
3. Netherlands: $1.3 billion (5.9%)
4. Thailand: $1.13 billion (5.1%)
5. Poland: $1.11 billion (4.9%)
6. Turkey: $1.06 billion (4.7%)
7. Ukraine: $715.4 million (3.2%)
8. Russia: $518.3 million (2.3%)
9. China: $303.6 million (1.4%)
10. Germany: $292 million (1.3%)
11. France: $279.1 million (1.2%)
12. Argentina: $279 million (1.2%)
13. Belarus: $237.7 million (1.1%)
14. Belgium: $181.8 million (0.8%)
15. Spain: $171.3 million (0.8%)
16. Denmark: $97.3 million (0.4%)
These countries shipped 91.4% of all frozen chicken meat exported in 2022.
Growth Trends in Frozen Chicken Exports
The fastest-growing exporters of frozen poultry since 2018 were:
- Belarus (up 234%)
- Russia (up 233.6%)
- Ukraine (up 96.1%)
- Turkey (up 93.5%)
There were declines in frozen poultry exports for:
- Denmark (down 16.1% from 2018)
- Belgium (down 12.3%)
- France (down 6.3%)
Retrieve Global Trade Data and Monitor Market Trends
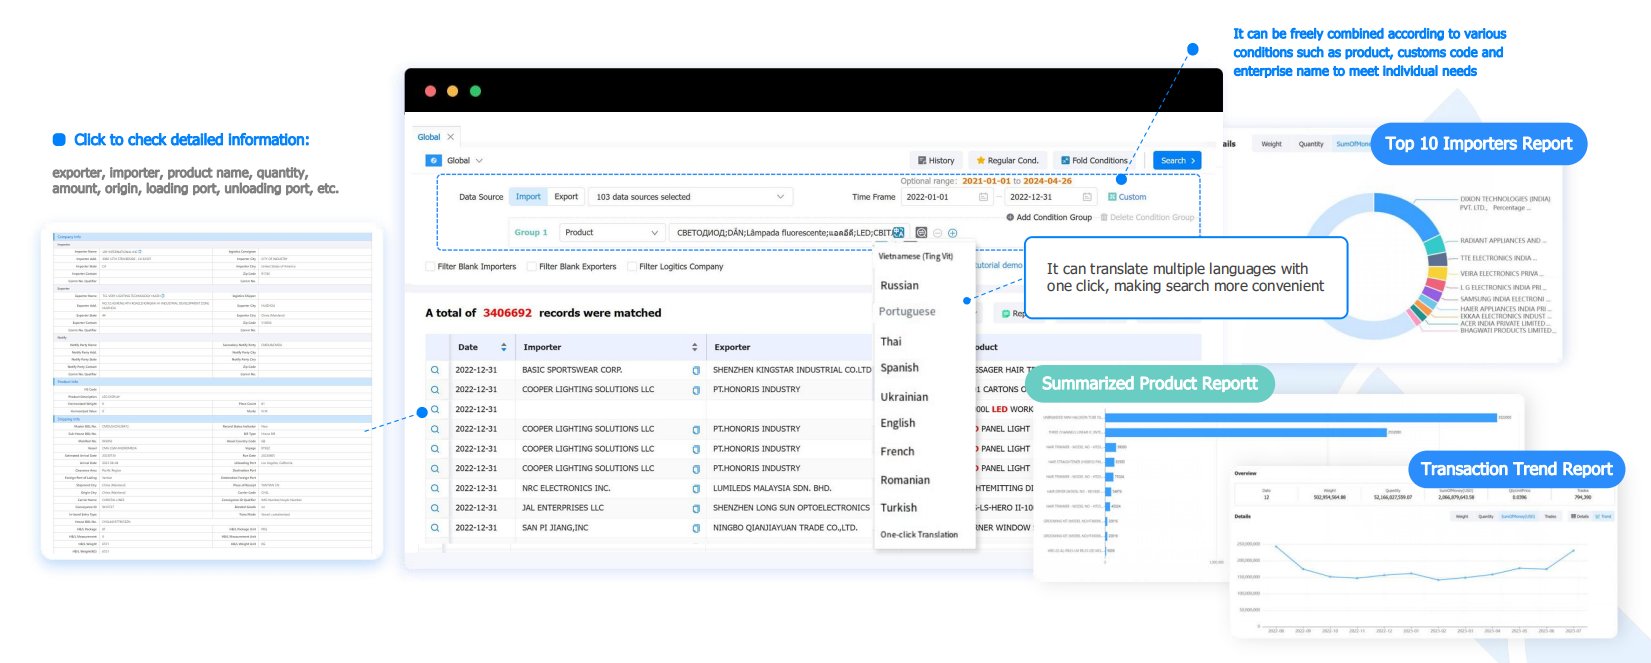
Tendata support one-click queries to track the global transaction details of specific products. Reflect the purchasing and supply activities throughout the entire supply chain and comprehensively display the state of the entire trade network.
Based on the statistical analysis of transaction data, view industry and product market trends to help businesses gain insights into market changes.
Tendata provides real-time, accurate, and detailed customs data, presenting the specifics of each transaction. Customized search criteria meet various filtering needs.

Category
Leave Message for Demo Request or Questions


 T-info
 T-discovery

 My
Tendata
 Market Analysis
 Customer
Development
 Competitor
Monitoring
 Customer Relationship


