 Market Insights
 18-07-2024
In 2022, global hazelnut exports totaled US$1.8 billion. This figure marks an
8.5% increase in value since 2018 when hazelnut export sales were $1.65 billion.
However, from 2021 to 2022, worldwide export revenues for hazelnuts fell by
-25.1%, dropping from $2.4 billion.
Hazelnuts, also known as cobnuts or filberts, come from the fruits of hazel trees. They are essential ingredients in products like candy pralines, chocolate truffles, and hazelnut paste products, including tortes, cakes, and other desserts. Hazelnuts are also key for flavoring ingredients, pastes, and powders.
By value, the five largest exporters of hazelnuts in 2022 were Türkiye, Italy, the United States, Chile, and Azerbaijan, which collectively accounted for 84.9% of all hazelnut exports.
In 2022, Asian countries led in hazelnut exports, shipping hazelnuts valued at $1.2 billion, or 66.2% of the global total. Europe followed with 19%, then North America at 8%, Latin America (excluding Mexico but including the Caribbean) at 6.7%, Africa at 0.02%, and Oceania (led by Australia) at 0.02%.

Top Hazelnut Exporting Countries
Below are the top 20 countries that exported the highest dollar value worth of hazelnuts during 2022, regardless of whether the hazelnuts were in-shell or shelled:
·Türkiye: US$971.8 million (54.1% of total exported hazelnuts)
·Italy: $177 million (9.9%)
·United States: $143.3 million (8%)
·Chile: $120.7 million (6.7%)
·Azerbaijan: $110.6 million (6.2%)
·Georgia: $96.1 million (5.4%)
·Germany: $48.6 million (2.7%)
·Netherlands: $45.2 million (2.5%)
·Spain: $20.8 million (1.2%)
·France: $16.6 million (0.9%)
·Czech Republic: $8.3 million (0.5%)
·Armenia: $5.5 million (0.3%)
·Poland: $4.4 million (0.2%)
·Lithuania: $2.9 million (0.2%)
·Austria: $2.5 million (0.1%)
·Slovakia: $1.98 million (0.1%)
·Belgium: $1.98 million (0.1%)
·Serbia: $1.79 million (0.1%)
·Sweden: $1.78 million (0.1%)
·China: $1.5 million (0.1%)
By value, these 20 countries shipped 99.3% of globally exported hazelnuts in 2022. Among the top exporters, mainland China was the only gainer compared to 2021, with a 320.8% increase. Countries that saw declines in their hazelnut export sales included Slovakia (down -52.5%), Italy (down -48.7%), Austria (down -42.4%), Belgium (down -34.3%), and the Czech Republic (down -32.9%).
Top Hazelnut Importing Countries
Global spending on imported hazelnuts decreased by -6.3% over the five-year period starting in 2018 and dropped by -18% year over year since 2021. Below are the 20 countries that imported the highest dollar value worth of hazelnuts in 2022, for both in-shell and shelled hazelnuts:
·Germany: US$467.9 million (28.1% of total imported hazelnuts)
·Italy: $347.4 million (20.8%)
·France: $143 million (8.6%)
·Canada: $85.4 million (5.1%)
·Netherlands: $80.4 million (4.8%)
·Russia: $76.5 million (4.6%)
·Switzerland: $58.6 million (3.5%)
·Brazil: $53.5 million (3.2%)
·Poland: $44.5 million (2.7%)
·China: $37.4 million (2.2%)
·Spain: $33.8 million (2%)
·Australia: $23.7 million (1.4%)
·Belgium: $22.9 million (1.4%)
·Austria: $19.9 million (1.2%)
·United States: $18.6 million (1.1%)
·Türkiye: $17.9 million (1.1%)
·Libya: $17.2 million (1%)
·United Kingdom: $16.1 million (1%)
·Egypt: $11.6 million (0.7%)
·Algeria: $10.9 million (0.7%)
By value, these 20 countries purchased 95.2% of globally imported hazelnuts in 2022. Among the top importers, the fastest-growing importers of hazelnuts since 2021 were Türkiye (up 27.6%), Libya (up 20.3%), Canada (up 13.2%), and Brazil (up 1.2%). Countries that posted declines in their imported hazelnut purchases included Egypt (down -53.3% from 2021), Belgium (down -40.2%), Poland (down -34.1%), France (down -33.8%), and the United Kingdom (down -28.4%).
Prices and Tariff Codes
In 2022, the average unit price paid by importers for in-shell hazelnuts was $4,287 per ton, reflecting a 9% increase from the 2021 average of $3,932 per ton. Shelled hazelnuts attracted a higher unit price, averaging $6,603 per ton in 2022, down -9.4% from the 2021 average of $7,284 per ton. The higher price for shelled hazelnuts is due in part to shelling labor costs and other processing expenses.
For research purposes, the Harmonized Tariff System codes for hazelnuts are 080221 for fresh or dried hazelnuts in-shell and 080222 for fresh or dried shelled hazelnuts. In 2022, 92.4% of hazelnuts exported worldwide by value were shelled, while the remaining 7.6% were in-shell.
The above information provides a comprehensive overview of the top hazelnut
exports and imports by country, highlighting key data and trends in the global
hazelnut market.
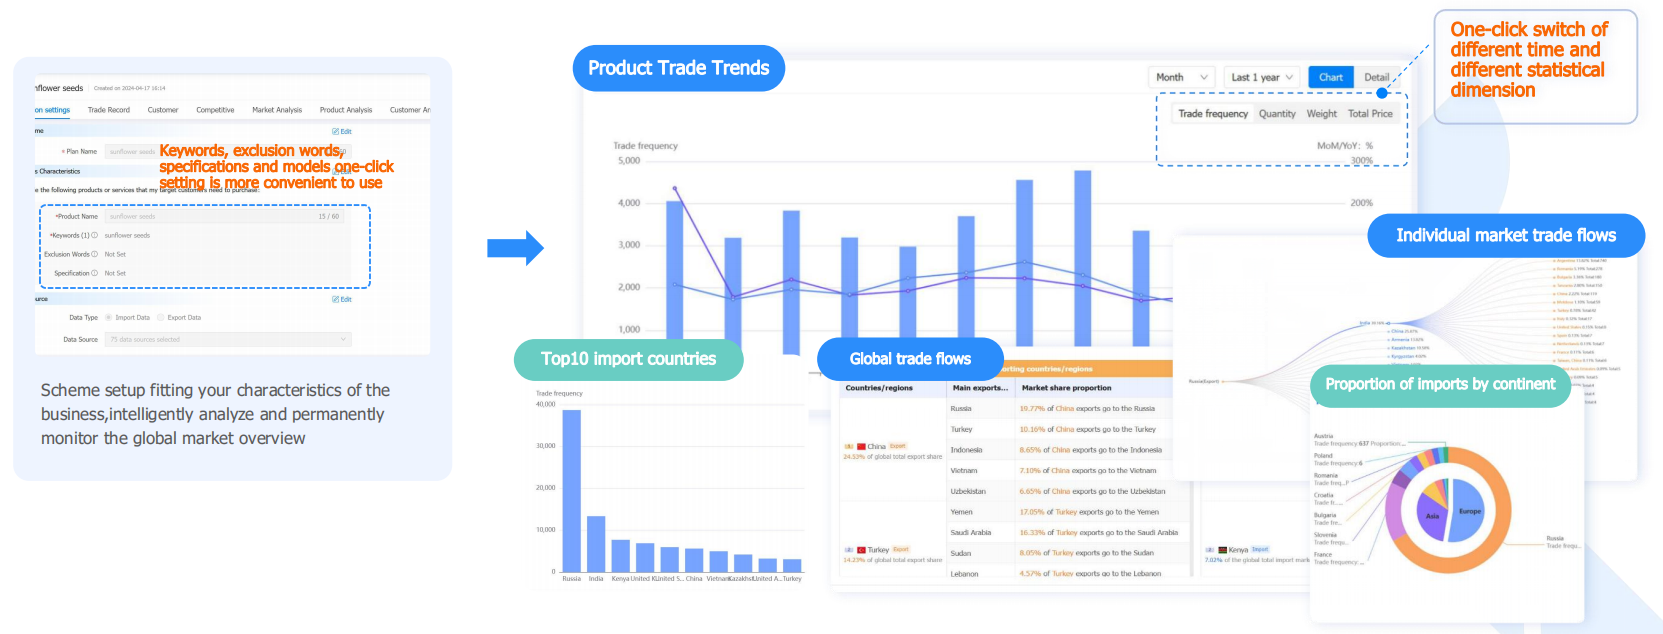
From traditional data retrieval to constructing business scenarios, Tendata T-Insight employs multiple analysts to work for you.
With intelligent market analysis, it assists in saving analysts' time and your money.
Eliminate the need for manual and frequent searches and analyses. With Tendata, you can effortlessly grasp product trade trends, trade flows, top 10 import and export countries with a single click, understand market trends, and identify high-value regions.

Category
Leave Message for Demo Request or Questions


 T-info
 T-discovery

 My
Tendata
 Market Analysis
 Customer
Development
 Competitor
Monitoring
 Customer Relationship


