 Market Insights
 04-07-2024
In 2022, global caviar exports, derived from fish eggs, reached a total value of $509.2 million.
The total sales for exported caviar increased by 12.7% from $451.7 million in 2018 but saw a decline of 12.2% from $580.3 million in 2021.
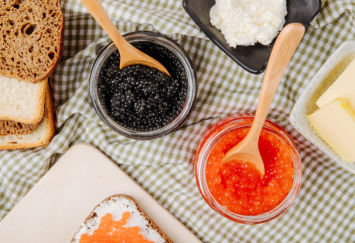
Out of the total for 2022, $199.5 million or 39.2% was attributed to traditional caviar, up from a 31.8% share in 2021. This traditional delicacy, made from wild sturgeon eggs from the Caspian Sea or the Black Sea, remains highly valued.
Alternative caviar, produced from non-sturgeon fish, generated $309.7 million in revenue, approximately 1.5 times the amount earned from traditional caviar. Despite the higher average unit price of traditional caviar ($214,056 per ton), which is almost 12 times that of non-sturgeon caviar ($18,433 per ton), alternative caviar remains a significant portion of the market.

Statistical Insights by Caviar Type
Revenue from traditional caviar exports grew by 65.7% over the five years from 2018 and by 10.5% from 2021 to 2022. In contrast, international sales of alternative caviar decreased by 6.5% since 2018 and fell by 22.5% from 2021 to 2022.
The top five exporters of traditional caviar are China, Italy, France, Germany, and Belgium, collectively accounting for 76% of global sales. For alternative caviar, the leading exporters, representing 65.7% of the market, are Japan, China, Germany, Sweden, and Denmark.
From a continental perspective, 51.9% of traditional caviar exports originated from Europe, followed by Asia at 42.9%. North America (2.8%), Africa (1.2%), Latin America and the Caribbean (1.1%), and Oceania (0.04%) contributed smaller shares.
For alternative caviar, Asia was the leading supplier with 50.6%, followed by Europe (44.3%), North America (4.1%), Latin America and the Caribbean (0.9%), Africa (0.03%), and Oceania (0.01%).
This analysis includes total export sales, average unit prices per ton, and key exporting countries by shipment weight.
Major Exporters of Traditional Caviar by Sales
The countries that led in traditional caviar exports in 2022 are ranked below by total international sales and their respective global market shares:
1. China: $76.6 million (38.4%)
2. Italy: $26.1 million (13.1%)
3. France: $23.6 million (11.8%)
4. Germany: $14.9 million (7.5%)
5. Belgium: $10.3 million (5.2%)
6. Poland: $9.9 million (5%)
7. United States: $4.6 million (2.3%)
8. Latvia: $3 million (1.5%)
9. Israel: $2.8 million (1.4%)
10. Bulgaria: $2.7 million (1.4%)
11. Madagascar: $2.4 million (1.2%)
12. Netherlands: $2.2 million (1.1%)
13. Uruguay: $2.1 million (1.1%)
14. Denmark: $2 million (1%)
15. Greece: $1.9 million (1%)
These 15 countries contributed 92.8% of the global traditional caviar exports in 2022.
Significant year-over-year sales increases were seen in Bulgaria (up 70.8%), Greece (up 39.8%), USA (up 32.2%), Belgium (up 28.6%), China (up 19.9%), and Denmark (up 18.8%). The Netherlands (down 27.5%), Uruguay (down 15.3%), and Israel (down 11.1%) experienced notable declines.
Leading Exporters of Alternative Caviar by Sales
The following countries led in exporting non-sturgeon caviar in 2022:
1. Japan: $73.9 million (23.9%)
2. China: $57 million (18.4%)
3. Germany: $40.6 million (13.1%)
4. Sweden: $16.5 million (5.3%)
5. Denmark: $15.5 million (5%)
6. United States: $12.3 million (4%)
7. Russia: $10.7 million (3.4%)
8. Iceland: $9.4 million (3%)
9. Netherlands: $8.6 million (2.8%)
10. Kazakhstan: $7.8 million (2.5%)
11. South Korea: $7.3 million (2.4%)
12. Vietnam: $5.8 million (1.9%)
13. Spain: $5.1 million (1.7%)
14. Belarus: $4.88 million (1.6%)
15. Latvia: $4.22 million (1.4%)
These 15 countries accounted for 90.3% of the global alternative caviar exports in 2022.
The fastest-growing exporters of non-traditional caviar were Vietnam (up 1,688%), China (up 24.7%), Japan (up 23.5%), and Spain (up 17.1%). Significant declines were recorded by Belarus (down 93.5%), Kazakhstan (down 63.3%), Russia (down 59.8%), Denmark (down 47.5%), and Iceland (down 18.7%).
Top Exporters of Traditional Caviar by Weight
In 2022, 932 tons of traditional sturgeon caviar were exported globally, marking a 12.3% increase from 2021 and a 4.1% rise since 2018. The leading exporters by weight are:
1. China: 266 tons (28.5%)
2. Poland: 97 tons (10.4%)
3. United States: 87 tons (9.3%)
4. Italy: 63 tons (6.8%)
5. Uganda: 49 tons (5.3%)
6. France: 36 tons (3.9%)
7. Latvia: 35 tons (3.8%)
8. Denmark: 30 tons (3.2%)
9. Malaysia: 27 tons (2.9%)
10. Czech Republic: 26 tons (2.8%)
11. Germany: 26 tons (2.8%)
12. Canada: 21 tons (2.3%)
13. Belgium: 19 tons (2%)
14. Russia: 18 tons (1.9%)
15. Maldives: 17 tons (1.8%)
The largest year-over-year increases in shipment weight were seen in Malaysia (up 800%), Poland (up 223.3%), Czech Republic (up 160%), and Russia (up 50%). Decreases were noted in the Maldives (down 34.6%) and Canada (down 32.3%).
Leading Exporters of Non-Traditional Caviar by Weight
In 2022, 16,802 tons of non-sturgeon caviar were exported, reflecting a 40.7% decline from 28,334 tons in 2021. The top exporters by weight are:
1. China: 4,183 tons (24.9%)
2. Japan: 2,097 tons (12.5%)
3. Germany: 1,791 tons (10.7%)
4. Sweden: 1,641 tons (9.8%)
5. United States: 756 tons (4.5%)
6. Belarus: 733 tons (4.4%)
7. Vietnam: 635 tons (3.8%)
8. Kazakhstan: 580 tons (3.5%)
9. Iceland: 576 tons (3.4%)
10. Russia: 534 tons (3.2%)
11. Denmark: 502 tons (3%)
12. South Korea: 400 tons (2.4%)
13. Netherlands: 364 tons (2.2%)
14. Norway: 249 tons (1.5%)
15. France: 190 tons (1.1%)
Significant increases in shipment weight were observed in the USA (up 43.5%), Norway (up 35.3%), France (up 31%), Japan (up 24.9%), and China (up 11.5%). Major declines were seen in Belarus (down 93.1%), Denmark (down 72.2%), Russia (down 67.1%), and Kazakhstan (down 49.7%).
From traditional data retrieval to constructing business scenarios, Tendata
T-Insight employs multiple analysts to work for you.
With intelligent market analysis, it assists in saving analysts' time and your money.
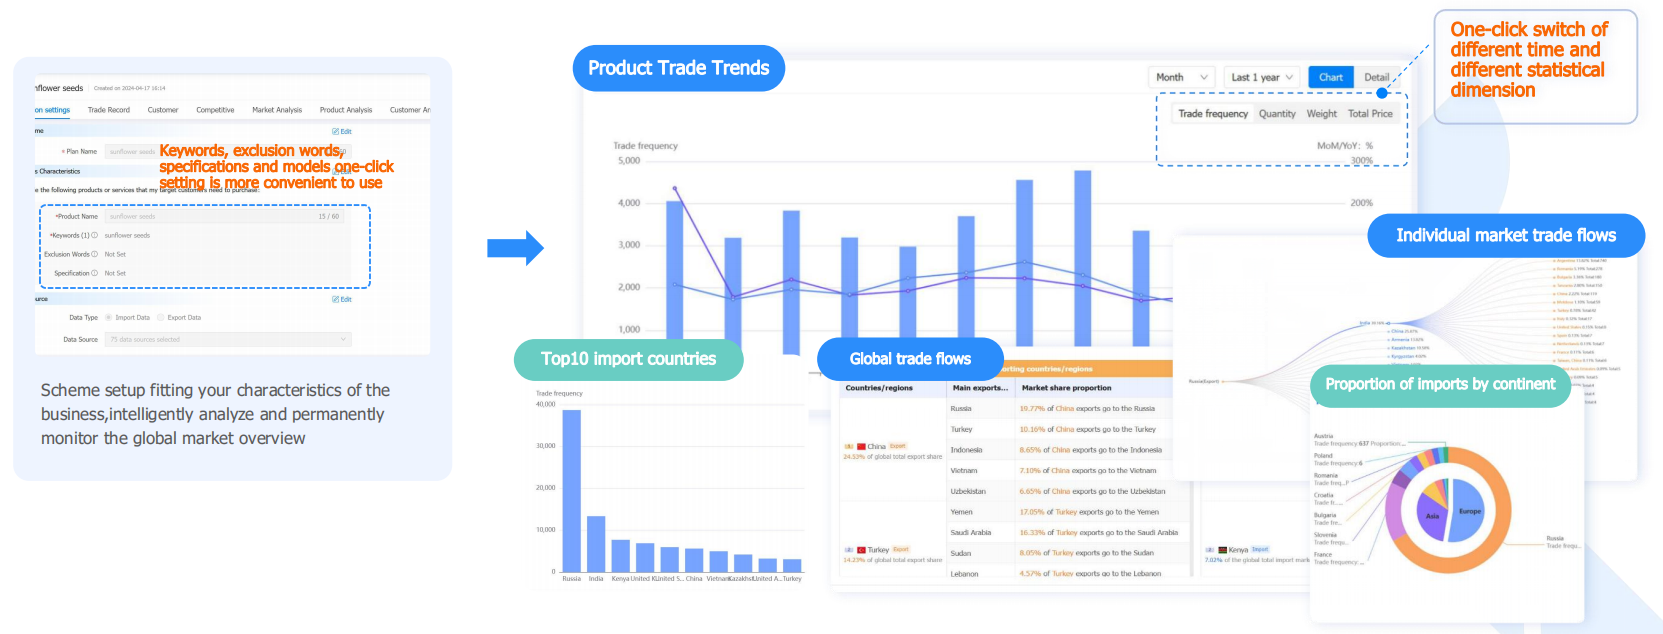
Eliminate the need for manual and frequent searches and analyses. With Tendata, you can effortlessly grasp product trade trends, trade flows, top 10 import and export countries with a single click, understand market trends, and identify high-value regions.

Category
Leave Message for Demo Request or Questions


 T-info
 T-discovery

 My
Tendata
 Market Analysis
 Customer
Development
 Competitor
Monitoring
 Customer Relationship


