 Market Insights
 02-07-2024
In 2022, global sugar imports amounted to a total of US$35 billion. This marked a significant 41.4% increase from 2018, when total global sugar purchases were valued at $24.8 billion. Year-over-year, the value of sugar imports rose by 16.7% from $30.1 billion in 2021.

Top Sugar Importers
The five leading importers of sugar in 2022 were Indonesia, mainland China, the United States, Italy, and South Korea. Together, these countries accounted for over a quarter (28%) of the world's total sugar imports.
From a regional perspective, Asian countries led the way with sugar purchases worth $16.9 billion, representing 48.1% of the global total. African nations followed with 21.1%, while Europe accounted for 17.5%. North America received 8.3% of sugar imports, followed by Latin America (excluding Mexico but including the Caribbean) with 4.4%, and Oceania, led by New Zealand, with 0.6%.
For those researching the market, the 4-digit Harmonized Tariff System code for sugar is 1701, covering solid-form cane or beet sugar and chemically pure sucrose.
Leading Sugar Importers by Country
Below are the 15 countries that imported the highest dollar value of sugar in 2022:
1. Indonesia: US$3 billion (8.6% of total sugar imports)
2. China: $2.6 billion (7.3%)
3. United States: $2.3 billion (6.5%)
4. Italy: $1 billion (2.9%)
5. South Korea: $977.6 million (2.8%)
6. Bangladesh: $973.5 million (2.8%)
7. Malaysia: $876.4 million (2.5%)
8. Spain: $859.6 million (2.5%)
9. Nigeria: $844.5 million (2.4%)
10. Sudan: $836.4 million (2.4%)
11. Morocco: $782.6 million (2.2%)
12. United Arab Emirates: $780.2 million (2.2%)
13. Algeria: $773.6 million (2.2%)
14. Saudi Arabia: $747.7 million (2.1%)
15. Canada: $626.9 million (1.8%)
These 15 countries accounted for 51.1% of all sugar imported in 2022. Among them, Spain saw the fastest growth in sugar imports (up 34.8%), followed by Italy (up 32.5%), Indonesia (up 25.9%), and the United Arab Emirates (up 23%). Conversely, four major importers recorded declines: Nigeria (down -6.3%), Malaysia (down -6.1%), Sudan (down -2.6%), and Algeria (down -0.5%).
Top Sugar Importers by Shipment Weight
Below are the leading countries by the total tonnage of sugar imports in 2022:
1. Sri Lanka: 446,745,914 tons (up 78,300% from 2021)
2. Indonesia: 6,007,603 tons (up 9.6%)
3. China: 5,274,506 tons (down -6.9%)
4. United States: 3,138,826 tons (up 8.9%)
5. Bangladesh: 2,368,172 tons (down -5%)
6. Algeria: 1,963,657 tons (down -16.9%)
7. South Korea: 1,946,919 tons (down -0.5%)
8. Malaysia: 1,885,470 tons (down -11%)
9. Italy: 1,835,271 tons (up 18.7%)
10. Sudan: 1,619,837 tons (down -11%)
11. Morocco: 1,562,181 tons (up 4.6%)
12. Iraq: 1,328,118 tons (up 41.2%)
13. Canada: 1,311,609 tons (down -2.3%)
14. Ethiopia: 1,247,697 tons (down -9.8%)
15. Chile: 1,128,499 tons (up 4.3%)
The most significant increases in sugar imports by shipment weight were recorded by Sri Lanka (up 78,300% from 2021), Iraq (up 41.2%), and Italy (up 18.7%). Major declines were seen in Sudan (down -11%), Malaysia (down -11%), and Ethiopia (down -9.8%).
Leading Sugar Import Companies in 2023
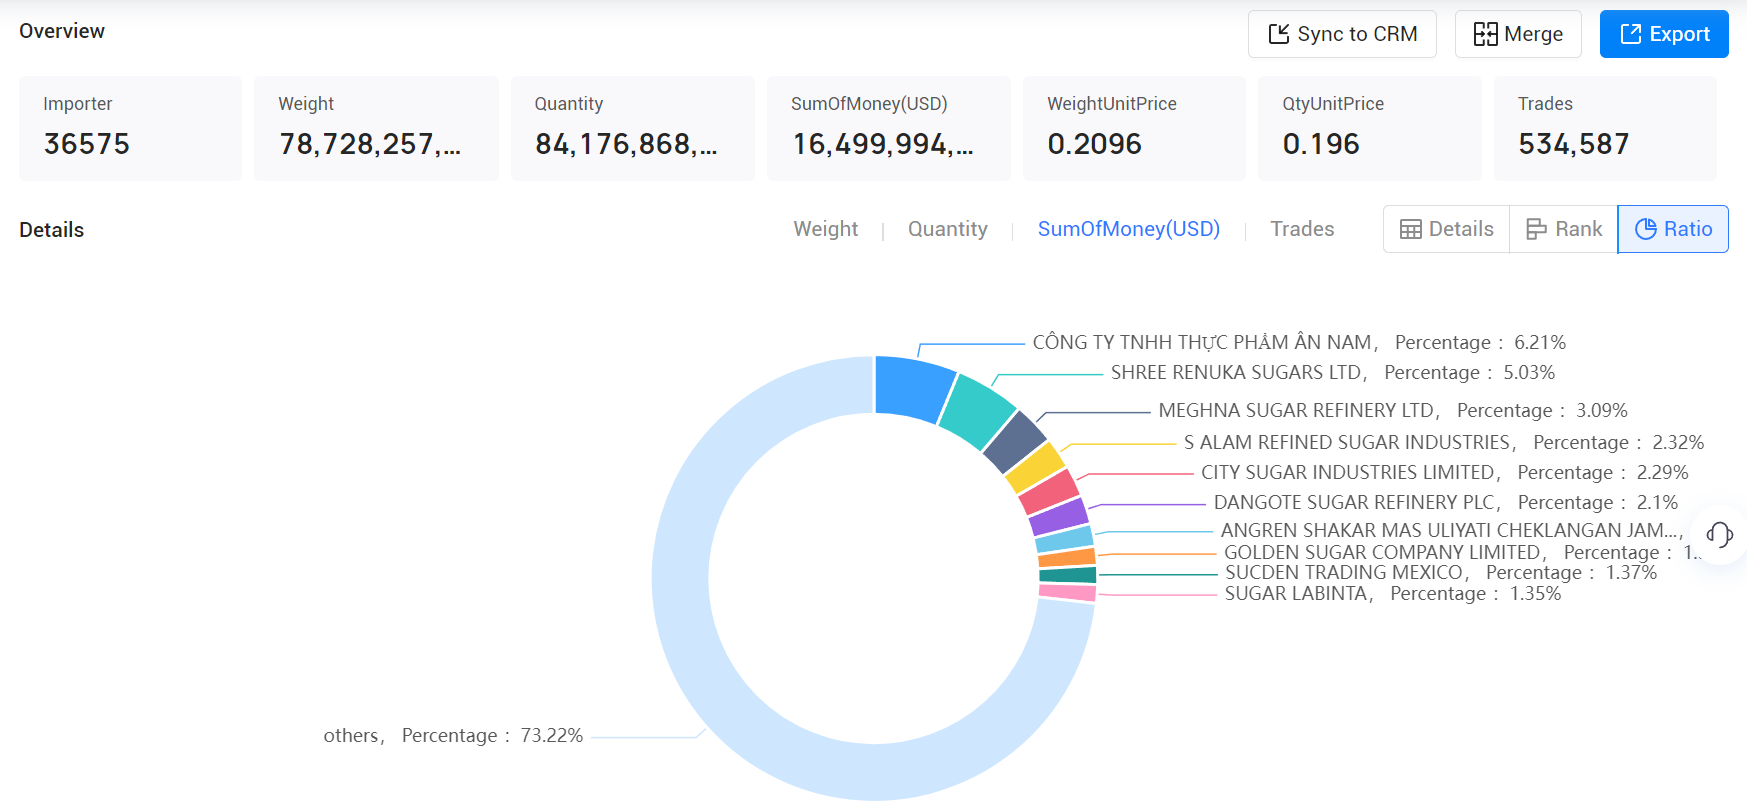
1. CÔNG TY TNHH THỰC PHẨM ÂN NAM: 6.21%, $1024.33 million
2. SHREE RENUKA SUGARS LTD: 5.03%, $830.32 million
3. MEGHNA SUGAR REFINERY LTD: 3.09%, $510.39 million
4. S ALAM REFINED SUGAR INDUSTRIES: 2.32%, $382.42 million
5. CITY SUGAR INDUSTRIES LIMITED: 2.29%, $378.18 million
6. DANGOTE SUGAR REFINERY PLC: 2.1%, $347.07 million
7. ANGREN SHAKAR MAS ULIYATI CHEKLANGAN JAMIYATI: 1.64%, $271.28 million
8. GOLDEN SUGAR COMPANY LIMITED: 1.37%, $226.56 million
9. SUCDEN TRADING MEXICO: 1.37%, $225.75 million
10. SUGAR LABINTA: 1.35%, $223.3 million
These companies were the top players in the global sugar import market in 2023, driving a significant portion of the trade.

From traditional data retrieval to constructing business scenarios, Tendata
T-Insight employs multiple analysts to work for you.
With intelligent market analysis, it assists in saving analysts' time and your money.
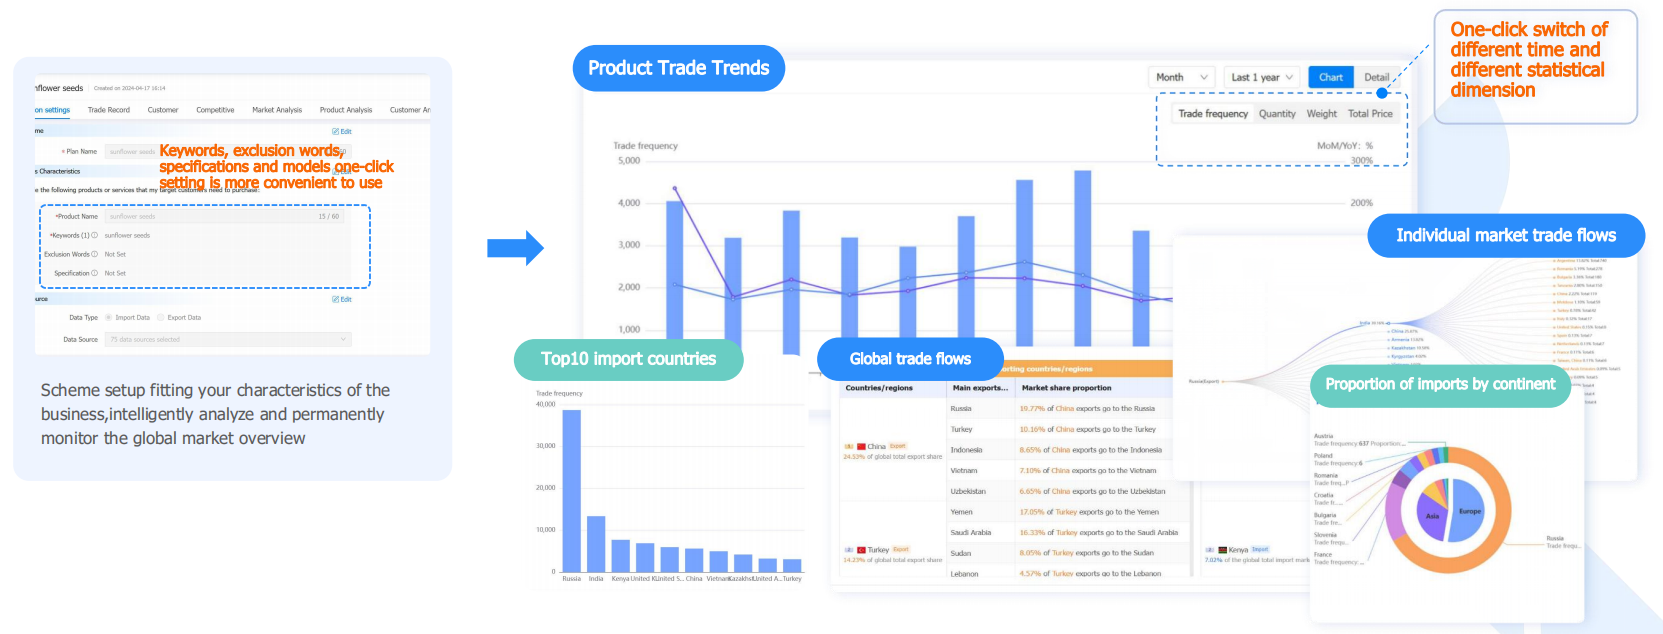
Eliminate the need for manual and frequent searches and analyses. With Tendata, you can effortlessly grasp product trade trends, trade flows, top 10 import and export countries with a single click, understand market trends, and identify high-value regions.

Category
Leave Message for Demo Request or Questions


 T-info
 T-discovery

 My
Tendata
 Market Analysis
 Customer
Development
 Competitor
Monitoring
 Customer Relationship


