 Market Insights
 25-06-2024
In 2022, global lithium ion battery exports reached a total value of $3.26 billion.
Thanks to their high energy density, minimal memory effect, and low self-discharge rate, lithium ion batteries are among the most commonly used rechargeable batteries in portable electronics.
Since 2018, the overall value of lithium ion battery exports has grown by an average of 13.4%, up from $2.88 billion. Year-over-year, revenue from these exports saw a modest increase of 1.7% in 2022 compared to $3.21 billion in 2021.
The top five exporters of lithium ion batteries were the United States, mainland China, Singapore, Hong Kong, and Indonesia. Combined, these countries accounted for over half (55.2%) of the global lithium ion battery exports in 2022.
By continent, Asian suppliers led the charge in 2022, exporting lithium ion batteries worth $1.74 billion, or 53.3% of the global total. Europe was next, with 28.2%, followed by North America, which contributed 17.8% of the worldwide lithium ion battery exports.
Smaller shares came from Africa (0.29%), Oceania (0.27%, primarily Australia), and Latin America (0.14%, excluding Mexico but including the Caribbean).
For reference, the Harmonized Tariff System (HTS) code for lithium ion batteries is 850650.

Leading Countries in Lithium Ion Battery Exports
Below are the 15 countries that exported the highest dollar value of lithium ion battery exports in 2022:
· United States: $488.7 million (15% of total exports)
· China: $476.7 million (14.6%)
· Singapore: $322.9 million (9.9%)
· Hong Kong: $281.6 million (8.6%)
· Indonesia: $229.9 million (7%)
· Germany: $199.4 million (6.1%)
· Japan: $164.7 million (5.1%)
· France: $141.2 million (4.3%)
· Netherlands: $119.8 million (3.7%)
· South Korea: $104.7 million (3.2%)
· Belgium: $90.5 million (2.8%)
· Poland: $81 million (2.5%)
· Israel: $66.7 million (2%)
· United Kingdom: $58.4 million (1.8%)
· Canada: $52 million (1.6%)
Collectively, these 15 countries accounted for 88.2% of all non-depleted lithium ion battery exports in 2022.
Among these top exporters, the fastest-growing since 2021 were Canada (up 37.1%), Israel (up 17%), South Korea (up 15.3%), and mainland China (up 9.7%).
Conversely, the countries with declining lithium ion battery exports included Japan (down 14.4%), Hong Kong (down 6.9%), the United Kingdom (down 6.8%), the Netherlands (down 5.7%), and Poland (down 5.1%).
Countries with the Largest Trade Surpluses in Lithium Ion Battery Exports
The following countries achieved the highest net exports of lithium ion batteries in 2022. Net exports, as defined by Investopedia, is the value of a country’s total exports minus its total imports. The figures below show the surplus between each country's lithium ion battery exports and imports for the same commodity.
· China: $239.4 million (up 39.7% since 2021)
· Indonesia: $202.3 million (up 0.9%)
· Japan: $110.2 million (down 22.5%)
· Singapore: $102.4 million (down 8.6%)
· United States: $69.3 million (down 20.3%)
· South Korea: $65.1 million (up 30%)
· Israel: $50.5 million (up 21.9%)
· France: $50.3 million (down 10.8%)
· Hong Kong: $38.3 million (up 1.6%)
· Pitcairn: $1,000 (no data available for 2021)
China had the largest trade surplus in the lithium ion battery exports sector, underscoring its significant competitive advantage in this market.
Countries with the Largest Trade Deficits in Lithium Ion Battery Exports
The following countries experienced the highest net import deficits for lithium ion batteries in 2022. Net exports, as defined by Investopedia, is the value of a country’s total exports minus its total imports. The statistics below highlight the deficit between each country's imports of lithium ion batteries and its lithium ion battery exports.
· Malaysia: -$214.1 million (deficit up 12.7% since 2021)
· Mexico: -$146.9 million (up 13%)
· Italy: -$77.3 million (up 34.7%)
· United Kingdom: -$70.4 million (up 92.8%)
· Vietnam: -$65.9 million (down 56.7%)
· Switzerland: -$62.4 million (up 31.5%)
· Ireland: -$57.1 million (up 33.9%)
· Canada: -$54.3 million (up 57.2%)
· United Arab Emirates: -$31.9 million (up 392.9%)
· Russia: -$30.5 million (down 12%)
· Czech Republic: -$28.5 million (up 82%)
· Thailand: -$25.4 million (down 3.3%)
· Taiwan: -$24.9 million (down 10.4%)
· India: -$24.7 million (up 60.8%)
· Australia: -$23 million (up 27%)
Malaysia and Mexico recorded the highest trade deficits in the lithium ion battery exports sector. These deficits highlight their competitive disadvantages but also present opportunities for suppliers to meet the strong demand in these markets.
Leading Companies in Lithium Ion Battery Exports
Below are some of the major global companies involved in lithium ion battery exports as of 2023-2024:
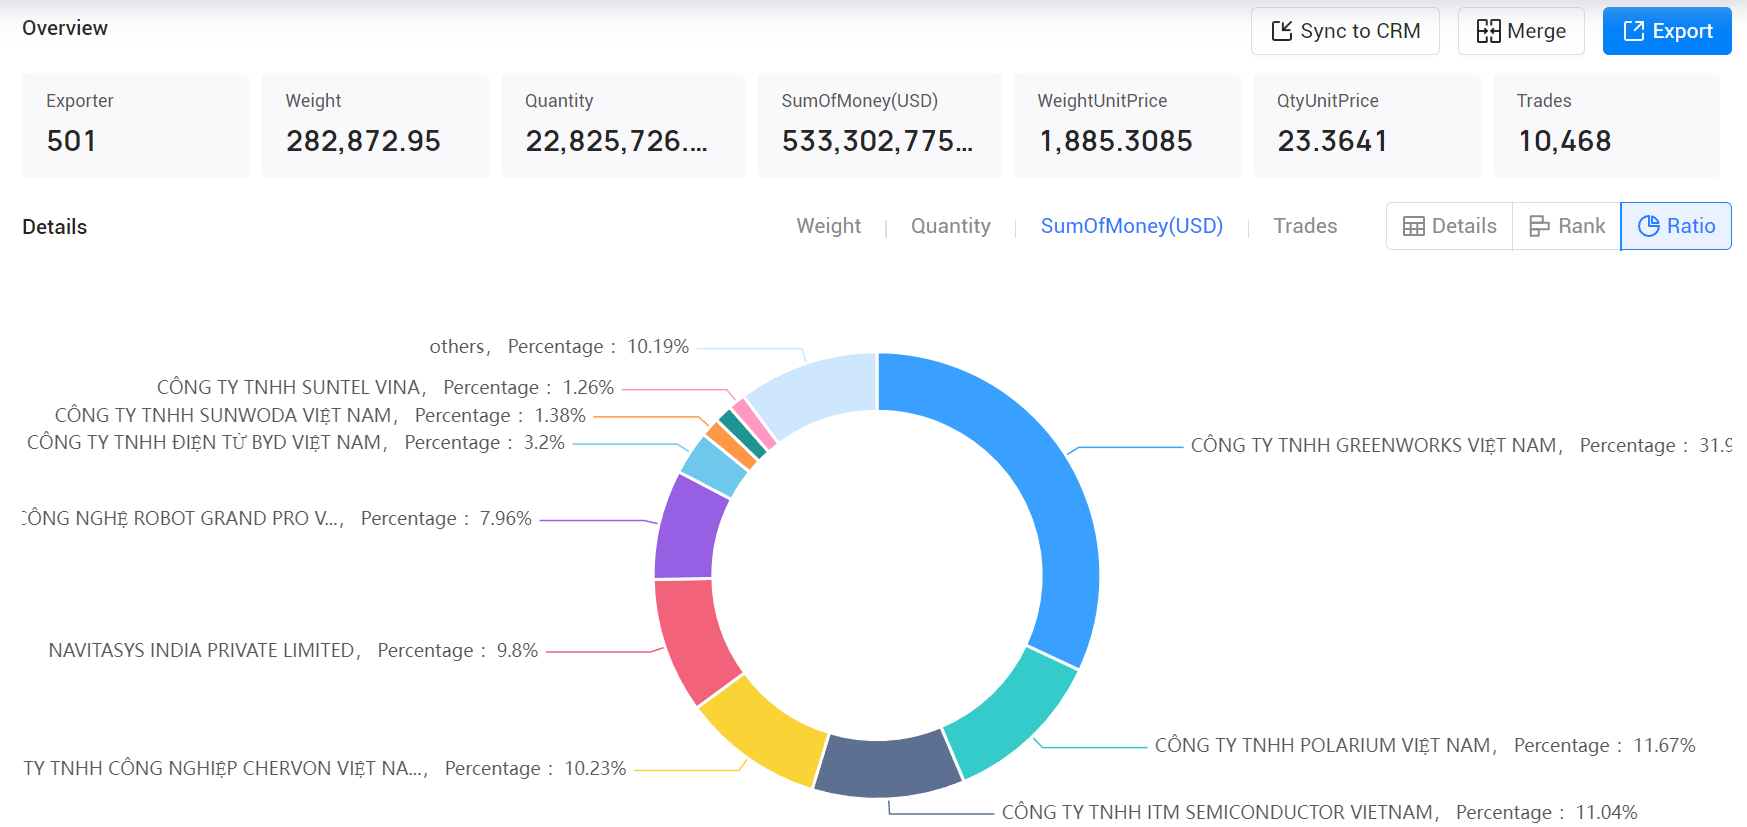
1. GREENWORKS VIỆT NAM CO., LTD (31.97%, $170.51 million)
2. POLARIUM VIỆT NAM CO., LTD (11.67%, $62.25 million)
3. ITM SEMICONDUCTOR VIETNAM CO., LTD (11.04%, $58.89 million)
4. CHERVON VIỆT NAM INDUSTRY CO., LTD (10.23%, $54.55 million)
5. NAVITASYS INDIA PRIVATE LIMITED (9.8%, $52.27 million)
6. GRAND PRO VIỆT NAM ROBOT TECHNOLOGY CO., LTD (7.96%, $42.44 million)
7. BYD VIỆT NAM ELECTRONICS CO., LTD (3.2%, $17.05 million)
8. SUNWODA VIỆT NAM CO., LTD (1.38%, $7.38 million)
9. SANMINA SCI (1.3%, $6.92 million)
10. SUNTEL VINA CO., LTD (1.26%, $6.74 million)

360° Product Intelligent Analysis Provides You with Insights into Performance Growth
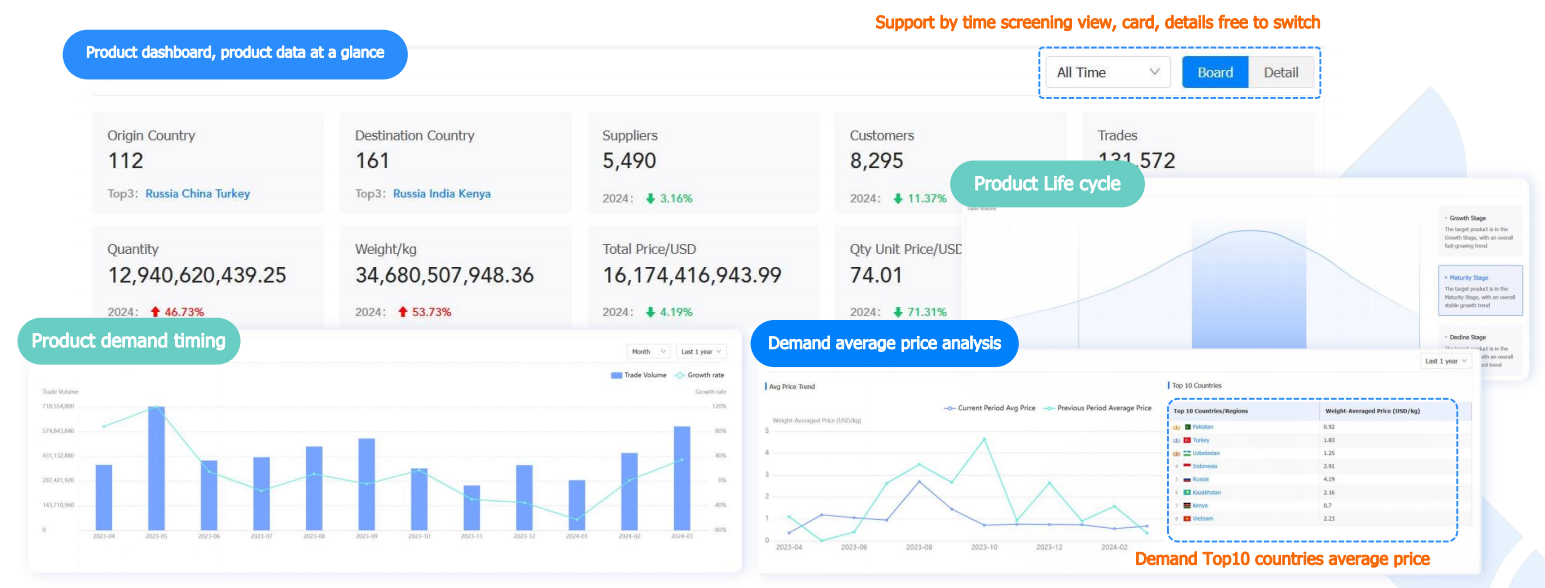
Utilizing Tendata's dashboard, which displays data on the number of origin countries, destination countries, customers, suppliers, etc., helps enterprises comprehend the global trade overview of products. Through multi-dimensional intelligent analysis, including product life cycle, average price analysis, and product supply time, it assists enterprises in predicting future performance growth points.
There's no need for manual analysis of the product overview; dynamic monitoring of volume and price uncovers potential growth points at a glance.

Category
Leave Message for Demo Request or Questions


 T-info
 T-discovery

 My
Tendata
 Market Analysis
 Customer
Development
 Competitor
Monitoring
 Customer Relationship


