 Market Insights
 24-06-2024
In 2022, the global export market for computer accessories reached a total value of US$157.6 billion. This represents a 10.6% increase from 2018, when the market was valued at $142.5 billion. However, year-over-year figures show a slight decline of -1.3% from 2021, which saw exports totaling $159.6 billion.
The top 5 exporters of computer accessories by value are China, Hong Kong, Taiwan, the United States, and Vietnam. These countries collectively accounted for 72.9% of global exports in this sector during 2022.
From a continental perspective, Asian countries dominated the market, exporting $122.5 billion worth of computer accessories, which constitutes 77.8% of the global total. North America followed with 12.5%, while Europe contributed 9.5%. Smaller shares came from Oceania (0.12%), led by Australia and New Zealand, Latin America (0.08%) excluding Mexico but including the Caribbean, and Africa (0.05%).
The 4-digit Harmonized Tariff System code prefix for computer parts and accessories, excluding covers and carrying cases, is 8473.

Top 15 Countries Exporting Computer Accessories in 2022
1. China: US$34.9 billion (22.2%)
2. Hong Kong: $30 billion (19%)
3. Taiwan: $19.4 billion (12.3%)
4. United States: $17.2 billion (10.9%)
5. Vietnam: $13.4 billion (8.5%)
6. South Korea: $12.5 billion (8%)
7. Singapore: $3.7 billion (2.4%)
8. Germany: $3.5 billion (2.3%)
9. Malaysia: $2.7 billion (1.7%)
10. Netherlands: $2.4 billion (1.5%)
11. Thailand: $2.2 billion (1.4%)
12. Mexico: $1.94 billion (1.2%)
13. Czech Republic: $1.9 billion (1.2%)
14. Japan: $1.32 billion (0.8%)
15. France: $1.31 billion (0.8%)
These 15 countries shipped 94.3% of the global computer accessories in 2022. Notably, Vietnam saw a 99.4% increase in exports since 2021, while the Czech Republic, France, and Mexico also posted significant growth. Conversely, Japan, the Netherlands, Germany, South Korea, and Hong Kong experienced declines.
Countries with the Largest Trade Surpluses in Computer Accessories
The following countries reported the highest net exports for computer accessories in 2022:
1. China: US$12.3 billion (up 13.5%)
2. Vietnam: $11.7 billion (up 123.4%)
3. Taiwan: $10.4 billion (up 2.9%)
4. South Korea: $6.4 billion (down -37.2%)
5. Hong Kong: $4.6 billion (down -38.2%)
6. Malaysia: $181.1 million (down -69.9%)
7. Denmark: $178.1 million (up 13.9%)
8. Cambodia: $66.1 million (down -27.5%)
9. Bahrain: $20.6 million (reversing a -$4.1 million deficit)
10. Slovenia: $11.8 million (down -43%)
11. Malta: $2.64 million (down -22.3%)
12. Samoa: $1.1 million (reversing a -$344,000 deficit)
13. Myanmar: $540,000 (down -92.7%)
14. Equatorial Guinea: $243,000 (down -163.8%)
China held the largest trade surplus, highlighting its competitive advantage in the computer accessories market.
Countries with the Largest Trade Deficits in Computer Accessories
The countries with the highest negative net exports in 2022 were:
1. United States: -US$17 billion (up 18.4%)
2. Mexico: -$12.1 billion (up 29.3%)
3. India: -$2.5 billion (up 31.7%)
4. Poland: -$2.2 billion (up 9.5%)
5. Germany: -$1.3 billion (down -7.7%)
6. Netherlands: -$1.28 billion (up 77.9%)
7. Brazil: -$1.23 billion (down -25.6%)
8. Japan: -$1.17 billion (up 36.6%)
9. Czech Republic: -$1.17 billion (down -53.7%)
10. Hungary: -$1.06 billion (up 20.5%)
11. Philippines: -$928.2 million (down -29.1%)
12. Ireland: -$893.7 million (up 105.2%)
13. United Kingdom: -$781.3 million (up 28.9%)
14. Russia: -$646.2 million (down -51.6%)
15. Singapore: -$606.6 million (down -39.5%)
The United States and Mexico faced the largest deficits, indicating a strong demand for imported computer accessories in these markets.
Leading Computer Accessories Exporting Companies
Here are some prominent global manufacturers of computer peripherals and accessories:
· BTC Behavior Tech Computer (Taiwan)
· Canon Inc. (Japan)
· Creative Technology Limited (Singapore)
· KYE Systems Corp. (Taiwan)
· Hama GmbH & Co KG (Germany)
· HP Hewlett-Packard Company (United States)
· Lenovo Group Ltd. (China)
· Logitech International SA (Switzerland)
· Sabrent (United States)
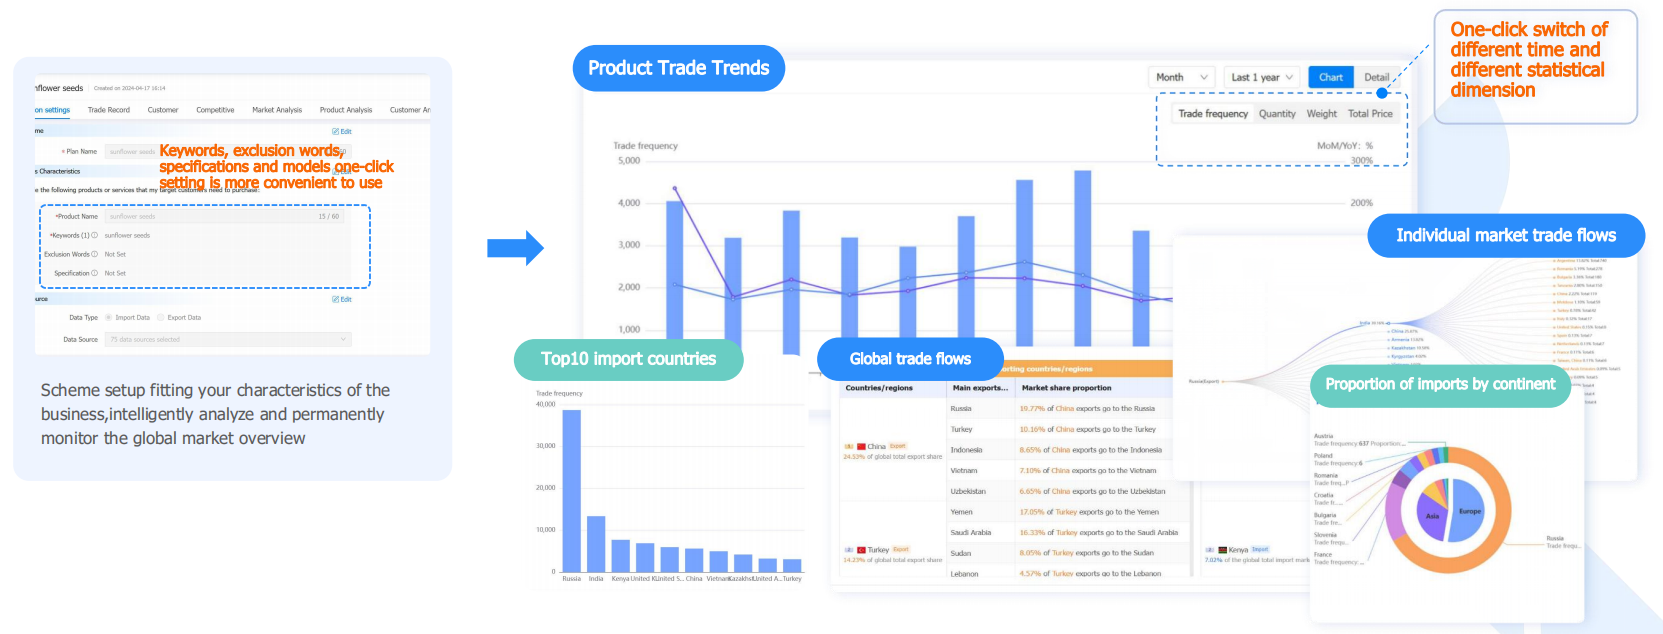
From traditional data retrieval to constructing business scenarios, Tendata
T-Insight employs multiple analysts to work for you.
With intelligent market analysis, it assists in saving analysts' time and your money.
Eliminate the need for manual and frequent searches and analyses. With Tendata, you can effortlessly grasp product trade trends, trade flows, top 10 import and export countries with a single click, understand market trends, and identify high-value regions.

Category
Leave Message for Demo Request or Questions


 T-info
 T-discovery

 My
Tendata
 Market Analysis
 Customer
Development
 Competitor
Monitoring
 Customer Relationship


