 Market Insights
 20-06-2024
In 2022, the global market for imported knitted or crocheted T-shirts reached a total value of US$49.7 billion. This represents a significant increase of 20.2% compared to 2018, when the total was $41.4 billion. From 2021 to 2022 alone, there was a notable 15.4% rise, with imports growing from $43.1 billion.
In terms of regional distribution, Europe led the way, importing T-shirts worth $24.7 billion, which accounted for about 49.7% of the global total in 2022. North America followed with 22.6% of the market share, and Asia accounted for 18.7%. Latin America, excluding Mexico but including the Caribbean, made up 5.3%, Oceania (primarily Australia and New Zealand) 2.1%, and Africa 1.5%.
Cotton remains the predominant material for T-shirt production, representing $35.9 billion or approximately 72.3% of all T-shirts imported in 2022. T-shirts made from other materials contributed $13.8 billion, equating to 27.3% of the total imports.
For those involved in trade research, the Harmonized Tariff System (HTS) code for knitted or crocheted T-shirts is 6109. Specifically, cotton T-shirts fall under 610910, while T-shirts made from other materials are classified as 610990.

Leading T-shirt Importing Countries
The top 15 countries importing the highest dollar value of knitted or crocheted T-shirts in 2022 were:
1. United States: US$9.3 billion (18.7% of total imports)
2. Germany: $4.8 billion (9.7%)
3. France: $2.7 billion (5.4%)
4. United Kingdom: $2.6 billion (5.2%)
5. Spain: $2.15 billion (4.3%)
6. Japan: $2.12 billion (4.3%)
7. Italy: $2 billion (4%)
8. Netherlands: $1.7 billion (3.5%)
9. Poland: $1.34 billion (2.7%)
10. Belgium: $1.27 billion (2.6%)
11. Canada: $1.05 billion (2.1%)
12. South Korea: $1.04 billion (2.1%)
13. China: $966.9 million (1.9%)
14. Mexico: $893.7 million (1.8%)
15. Australia: $863 million (1.7%)
These 15 countries accounted for 70.1% of all T-shirt imports in 2022. The fastest-growing markets since 2018 were Mexico (up 66.9%), Poland (up 59.7%), the United States (up 51.6%), and Canada (up 43.7%). Meanwhile, Japan, Belgium, and the United Kingdom saw declines in their T-shirt imports by 11%, 4.7%, and 3.3% respectively.
Cotton T-shirt Imports by Country
Focusing specifically on cotton T-shirts, the top importing countries in 2022 were:
1. United States: US$6.6 billion (18.3% of cotton T-shirt imports)
2. Germany: $3.5 billion (9.6%)
3. France: $1.9 billion (5.4%)
4. United Kingdom: $1.8 billion (5.1%)
5. Spain: $1.63 billion (4.6%)
6. Italy: $1.6 billion (4.5%)
7. Japan: $1.3 billion (3.6%)
8. Netherlands: $1.2 billion (3.5%)
9. Poland: $1.1 billion (3%)
10. Belgium: $890.4 million (2.5%)
11. China: $731.8 million (2%)
12. Canada: $718.2 million (2%)
13. South Korea: $680.8 million (1.9%)
14. Mexico: $673.7 million (1.9%)
15. Australia: $640.5 million (1.8%)
These countries purchased 69.5% of all cotton T-shirts imported globally in 2022. The fastest growth since 2018 was seen in Poland (up 78.6%), Mexico (up 75.8%), the United States (up 54.8%), and Canada (up 47.1%). The United Kingdom and Belgium showed the smallest increases, at 0.3% and 0.5% respectively.
Non-Cotton T-shirt Imports by Country
For T-shirts made from non-cotton textiles, the leading importers in 2022 were:
1. United States: US$2.7 billion (19.9% of non-cotton T-shirt imports)
2. Germany: $1.4 billion (10%)
3. Japan: $818.7 million (6%)
4. United Kingdom: $783.9 million (5.7%)
5. France: $765.3 million (5.6%)
6. Spain: $511.9 million (3.7%)
7. Netherlands: $480.8 million (3.5%)
8. Italy: $407.1 million (3%)
9. Belgium: $383 million (2.8%)
10. South Korea: $362.2 million (2.6%)
11. Canada: $333.8 million (2.4%)
12. Poland: $270.4 million (2%)
13. China: $235 million (1.7%)
14. Australia: $222.4 million (1.6%)
15. Austria: $214.1 million (1.6%)
These 15 countries were responsible for 71.9% of all non-cotton T-shirt imports in 2022. The United States (up 44.5%), Canada (up 36.9%), the Netherlands (up 13.3%), and Poland (up 12.4%) showed the fastest growth in non-cotton T-shirt imports since 2018. In contrast, Japan, Spain, Italy, and Belgium saw declines of 30.1%, 18.7%, 17.3%, and 15% respectively.
Leading T-shirt Exporting Companies
According to Tendata, the following companies are notable suppliers in the international T-shirt market:
- B2B Print SIA (Latvia)
- CIAO Develop Co., Ltd (Taiwan)
- Dongguan Qinghuo Apparel Co., Ltd (China)
- Fashion Mag Trade (Italy)
- Guangzhou Mingmen Garments (China)
- Iniz Solutions (India)
- MONA Trading B2B (Poland)
- OITA Sports Industries (Pakistan)
- Push Top Service & Trading Co., Ltd (Vietnam)
- Xiangshan Eco-Friendly Knitting Co. (China)
These companies represent major players in the B2B sector for T-shirt trading, with their headquarters based in various countries around the world.
Retrieve Global Trade Data and Monitor Market Trends
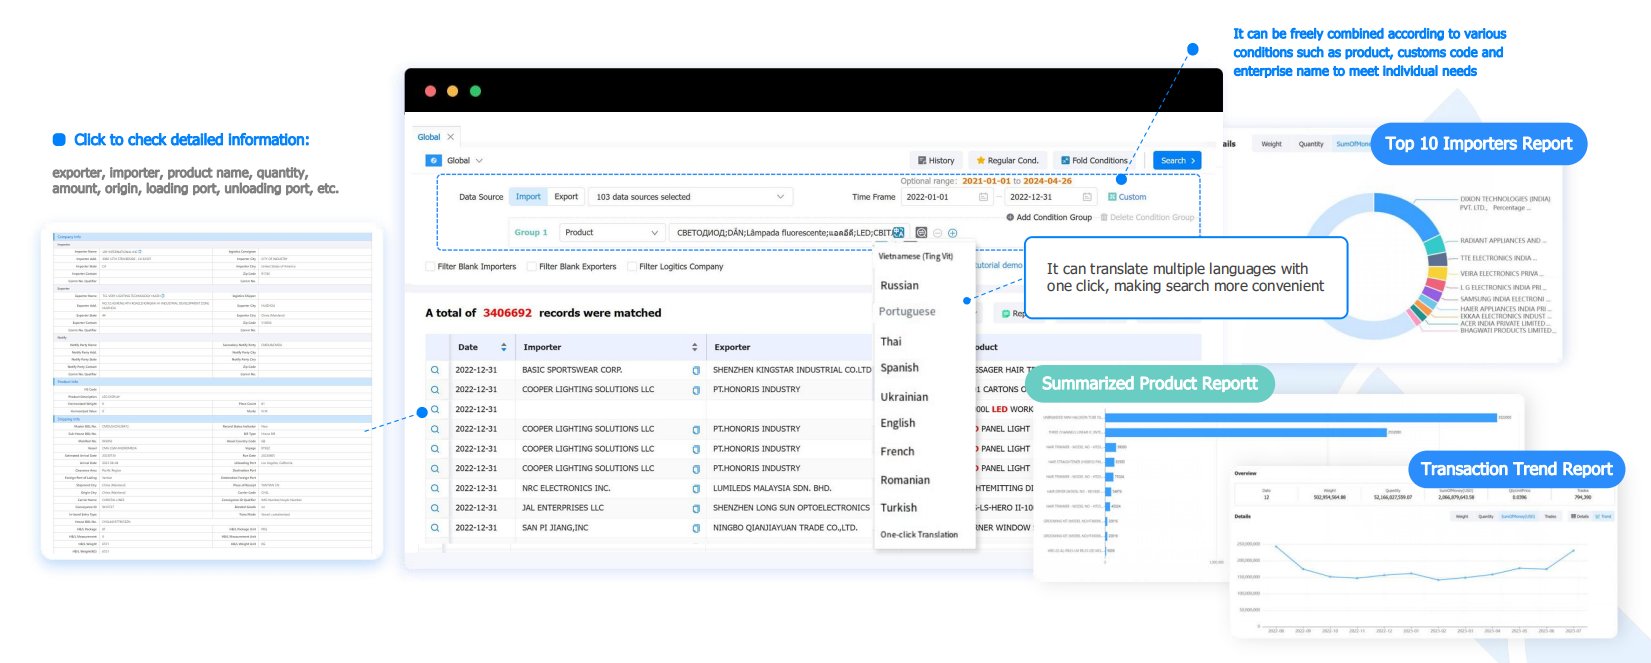
Tendata support one-click queries to track the global transaction details of specific products. Reflect the purchasing and supply activities throughout the entire supply chain and comprehensively display the state of the entire trade network.
Based on the statistical analysis of transaction data, view industry and product market trends to help businesses gain insights into market changes.
Tendata provides real-time, accurate, and detailed customs data, presenting the specifics of each transaction. Customized search criteria meet various filtering needs.

Category
Leave Message for Demo Request or Questions


 T-info
 T-discovery

 My
Tendata
 Market Analysis
 Customer
Development
 Competitor
Monitoring
 Customer Relationship


