 Market Insights
 20-06-2024
In 2022, global exports of magnets and electromagnets reached a total value of US$12.7 billion. This represents a substantial 35% increase from the $9.4 billion recorded in 2018. Year-over-year, the export value rose by 15.9%, up from $11 billion in 2021.
Permanent magnets have various applications, such as magnetic strips on credit cards, compasses, magnetic clasps on jewelry, and refrigerator magnets. They are also used in tools for picking up small metal items. In contrast, the strength of electromagnets depends on the electrical current they conduct. These are critical in devices like motors, generators, speakers, hard disks, scientific instruments, transformers, battery chargers, and sensors. Electromagnets are also vital in industrial applications, such as in scrap yards for lifting heavy metallic objects.
In 2022, non-electrical permanent magnets constituted 66.2% of the total international sales for magnets, including electromagnets. Electromagnets and related parts (excluding those for medical use) accounted for 25.5%, while electromagnetic couplings, clutches, and brakes made up the remaining 8.3%.
For reference, the 4-digit Harmonized Tariff System (HTS) code prefix for magnets, including electromagnets (excluding those used for medical purposes), is 8505.

Major Magnets and Electromagnets Exporters by Country
Here are the top 25 countries exporting magnets, including electromagnets, by dollar value in 2022:
1. China: US$5.9 billion (46.4% of global exports)
2. Germany: $1.23 billion (9.7%)
3. Japan: $1.17 billion (9.2%)
4. Vietnam: $508.4 million (4%)
5. United States: $466.4 million (3.7%)
6. Philippines: $286 million (2.2%)
7. South Korea: $275.6 million (2.2%)
8. France: $259 million (2%)
9. Italy: $230.7 million (1.8%)
10. Switzerland: $210.5 million (1.7%)
11. Hong Kong: $203.3 million (1.6%)
12. United Kingdom: $171.6 million (1.3%)
13. Netherlands: $162.3 million (1.3%)
14. Poland: $125.7 million (1%)
15. Malaysia: $125.1 million (1%)
16. Taiwan: $121.3 million (1%)
17. Thailand: $118.7 million (0.9%)
18. Czech Republic: $110 million (0.9%)
19. Austria: $91.9 million (0.7%)
20. Spain: $91.6 million (0.7%)
21. Mexico: $87.8 million (0.7%)
22. New Zealand: $86.1 million (0.7%)
23. Romania: $69 million (0.5%)
24. India: $57.4 million (0.5%)
25. Singapore: $50.9 million (0.4%)
These 25 countries accounted for 96.3% of all magnets, including electromagnets, exported globally in 2022. Notable growth in exports since 2021 was seen from Vietnam (up 66.8%), Poland (up 57.9%), China (up 33.3%), and New Zealand (up 22.8%). On the other hand, significant declines were recorded by Hong Kong (down 28.7%), South Korea (down 12.8%), France (down 5.2%), Malaysia (down 4.7%), Thailand (down 3.7%), and the Czech Republic (down 3.5%).
Trade Surpluses in Magnets
The countries with the highest positive net exports (export value minus import value) for magnets and electromagnets in 2022 were:
1. China: US$5 billion (net export surplus up 45.1% from 2021)
2. New Zealand: $76.2 million (up 24.2%)
3. Japan: $57.5 million (down 85%)
4. Israel: $20.8 million (up 84.8%)
5. Hong Kong: $17.8 million (reversing a $8.4 million deficit)
6. Ireland: $6.5 million (down 43%)
7. Sierra Leone: $507,000 (down 9.5%)
8. Equatorial Guinea: $116,000 (reversing a $26,000 deficit)
9. Anguilla: $23,000 (up 130%)
10. US Minor Outlying Islands: $17,000 (up 41.7%)
China had the largest trade surplus, underscoring its competitive edge in the global magnets market.
Trade Deficits in Magnets
Conversely, the countries with the highest net import deficits in magnets and electromagnets in 2022 were:
1. United States: -US$960 million (net export deficit up 22.3% from 2021)
2. Mexico: -$479.2 million (up 17.9%)
3. South Korea: -$478.5 million (up 197.9%)
4. Philippines: -$362.5 million (up 48.2%)
5. Thailand: -$332.4 million (up 15.2%)
6. India: -$277.9 million (up 42.3%)
7. Germany: -$265.5 million (reversing a $65.2 million surplus)
8. France: -$214.6 million (down 24.4%)
9. Hungary: -$182.2 million (up 10.8%)
10. Poland: -$176.7 million (up 15.6%)
The United States had the largest trade deficit, highlighting its high demand for imported magnets and electromagnets, creating opportunities for exporting countries.
Leading Companies in Magnets Manufacturing
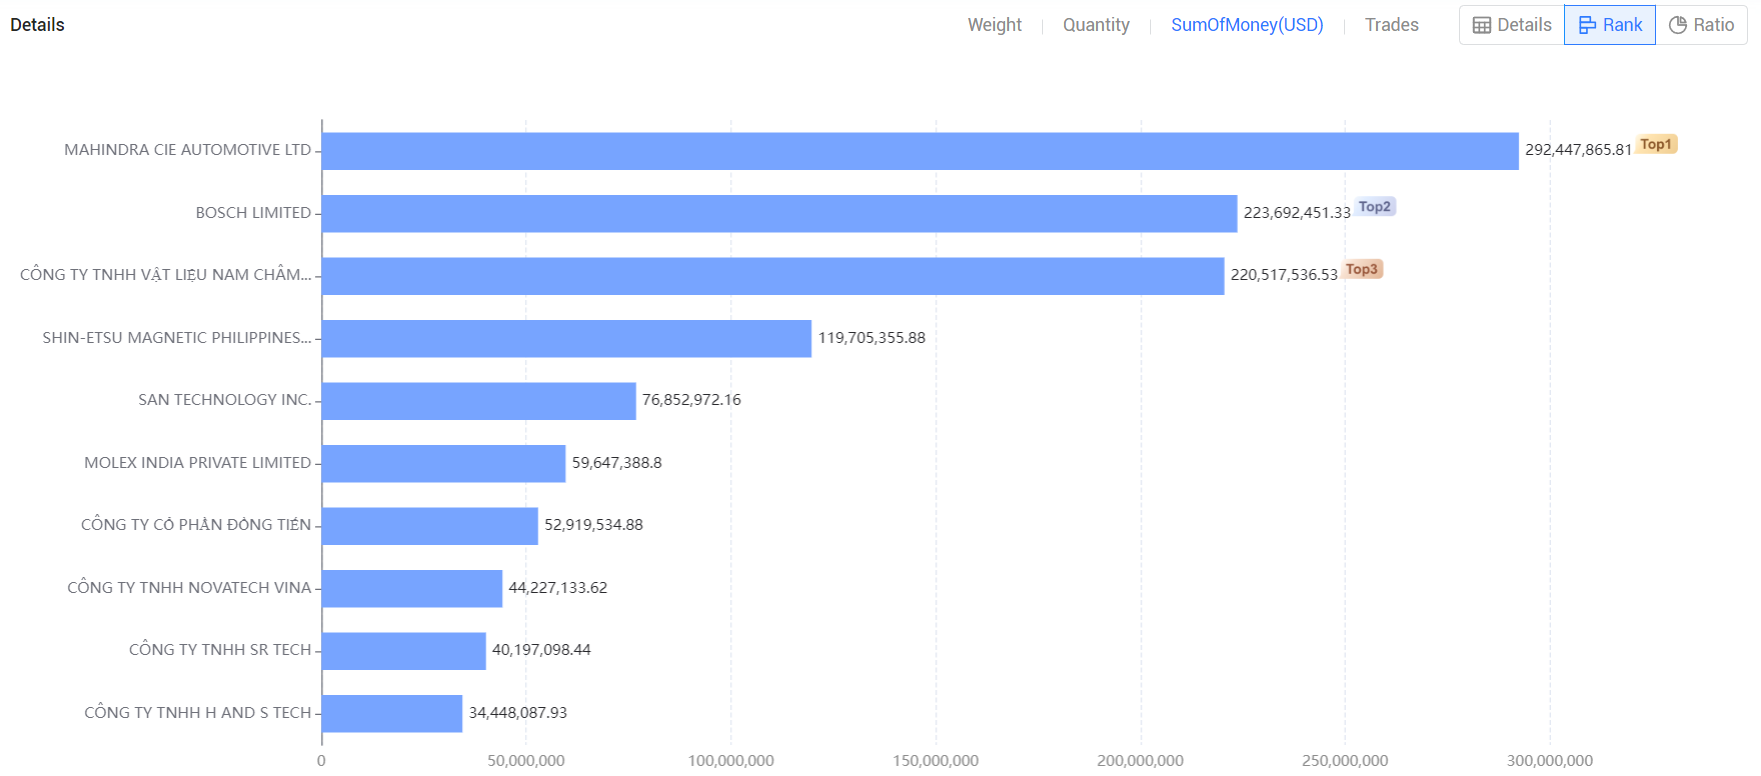
In 2023, prominent companies in the magnets industry included:
1. MAHINDRA CIE AUTOMOTIVE LTD: 19.28%, $292.45 million
2. BOSCH LIMITED: 14.75%, $223.69 million
3. CÔNG TY TNHH VẬT LIỆU NAM CHÂM SHIN ETSU VIỆT NAM: 14.54%, $220.52 million
4. SHIN-ETSU MAGNETIC PHILIPPINES, INC.: 7.89%, $119.71 million
5. SAN TECHNOLOGY INC.: 5.07%, $76.85 million
6. MOLEX INDIA PRIVATE LIMITED: 3.93%, $59.65 million
7. CÔNG TY CỔ PHẦN ĐỒNG TIẾN: 3.49%, $52.92 million
8. CÔNG TY TNHH NOVATECH VINA: 2.92%, $44.23 million
9. CÔNG TY TNHH SR TECH: 2.65%, $40.2 million
10. CÔNG TY TNHH H AND S TECH: 2.27%, $34.45 million
These companies represent significant players in the global market for permanent magnets and electromagnets.

Retrieve Global Trade Data and Monitor Market Trends
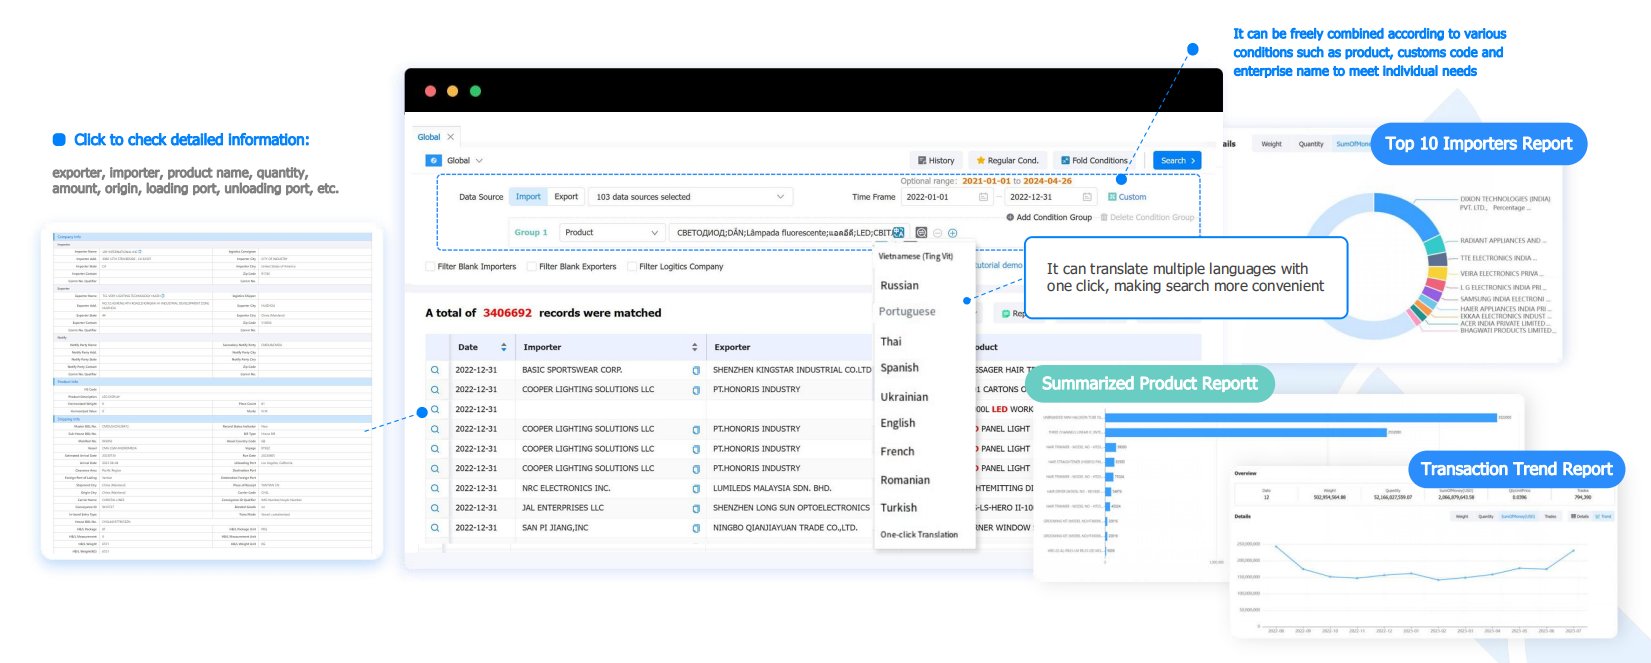
Tendata support one-click queries to track the global transaction details of specific products. Reflect the purchasing and supply activities throughout the entire supply chain and comprehensively display the state of the entire trade network.
Based on the statistical analysis of transaction data, view industry and product market trends to help businesses gain insights into market changes.
Tendata provides real-time, accurate, and detailed customs data, presenting the specifics of each transaction. Customized search criteria meet various filtering needs.

Category
Leave Message for Demo Request or Questions


 T-info
 T-discovery

 My
Tendata
 Market Analysis
 Customer
Development
 Competitor
Monitoring
 Customer Relationship


