 Market Insights
 19-06-2024
The total global export value of garlic from all nations reached US$2.68 billion in 2022, marking a significant increase of 25.6% from $2.13 billion in 2018.
On a year-on-year basis, the worldwide export of garlic experienced a decline of -14.8%, compared to $3.14 billion in 2021.
Garlic, renowned for its strong and pungent flavor reminiscent of horseradish or a blend of minced onions and chives, is widely used as a seasoning ingredient. It is also utilized for medicinal purposes in various cultures, both in its raw and cooked forms.
Mainland China, Spain, Argentina, the Netherlands, and France emerged as the top five garlic exporters globally, collectively contributing to 90.9% of the revenues generated from garlic sales in international markets during 2022. This concentration of major suppliers underscores the intense competition in the garlic market.
From a regional perspective, Asian countries accounted for over two-thirds (68.7%) of the global garlic exports in 2022, with a total value of $1.84 billion. European exporters followed closely at 21.1%, while Latin American countries, excluding Mexico but including the Caribbean, contributed 6.8% to the global garlic shipments.
Smaller proportions of garlic exports originated from North America (2.2%), Africa (1.2%), and Oceania, including New Zealand, Australia, Samoa, and Fiji (0.02%).
The Harmonized Tariff System code prefix for garlic is 070320, useful for research purposes.

Leading Garlic Exports by Nation
Here's a list of the top 15 countries that exported the highest value of garlic in 2022:
1. China: US$1.8 billion (67% of total garlic exports)
2. Spain: $388.3 million (14.5%)
3. Argentina: $131.8 million (4.9%)
4. Netherlands: $82.6 million (3.1%)
5. France: $37.4 million (1.4%)
6. Mexico: $36.2 million (1.4%)
7. Egypt: $29.6 million (1.1%)
8. Italy: $29 million (1.1%)
9. Chile: $26.4 million (1%)
10. Peru: $23.2 million (0.9%)
11. United States: $20.9 million (0.8%)
12. Malaysia: $11.8 million (0.4%)
13. India: $8.8 million (0.3%)
14. Slovenia: $4 million (0.2%)
15. Uzbekistan: $3.7 million (0.1%)
These 15 countries collectively accounted for 98.2% of the total global garlic exports in 2022.
Among these exporters, India, Slovenia, Malaysia, and Mexico demonstrated the fastest growth in garlic exports since 2021, while Chile, the Netherlands, Italy, Spain, and France experienced declines in their garlic export revenues.
Top Garlic Exporters by Net Exports
Here are the countries with the highest positive net exports for garlic in 2022, according to Investopedia:
1. China: US$1.8 billion (net export surplus down -11.7% since 2021)
2. Spain: $377.5 million (down -19.2%)
3. Argentina: $131.1 million (down -10.6%)
4. Netherlands: $27.4 million (down -45.4%)
5. Egypt: $24.4 million (up 92.9%)
6. Peru: $23.2 million (up 18.6%)
7. Chile: $19 million (down -44%)
8. Mexico: $18.5 million (reversing a -$6.9 million deficit)
9. India: $7.3 million (up 266.1%)
10. Turkey: $2.9 million (reversing a -$375,000 deficit)
Mainland China emerged with the highest surplus in garlic trade, indicating its strong competitive position in this market segment.
Countries with Largest Garlic Trade Deficits
These countries posted the highest negative net exports for garlic in 2022:
1. Indonesia: -US$597.8 million (net export deficit down -10.2% since 2021)
2. United States: -$260.5 million (up 9.3%)
3. Vietnam: -$232 million (up 217%)
4. Brazil: -$143.2 million (down -13.5%)
5. Malaysia: -$134.5 million (down -5.9%)
6. Germany: -$87 million (down -18.8%)
7. United Arab Emirates: -$74.7 million (up 217.1%)
8. United Kingdom: -$70.5 million (up 44.4%)
9. Pakistan: -$59.8 million (down -10.8%)
10. Russia: -$59.1 million (down -18.7%)
Indonesia faced the highest deficit in garlic trade, indicating its relatively weaker position in this segment. However, this also presents opportunities for garlic-supplying countries to meet the demand in such markets.
Garlic Exporting Companies
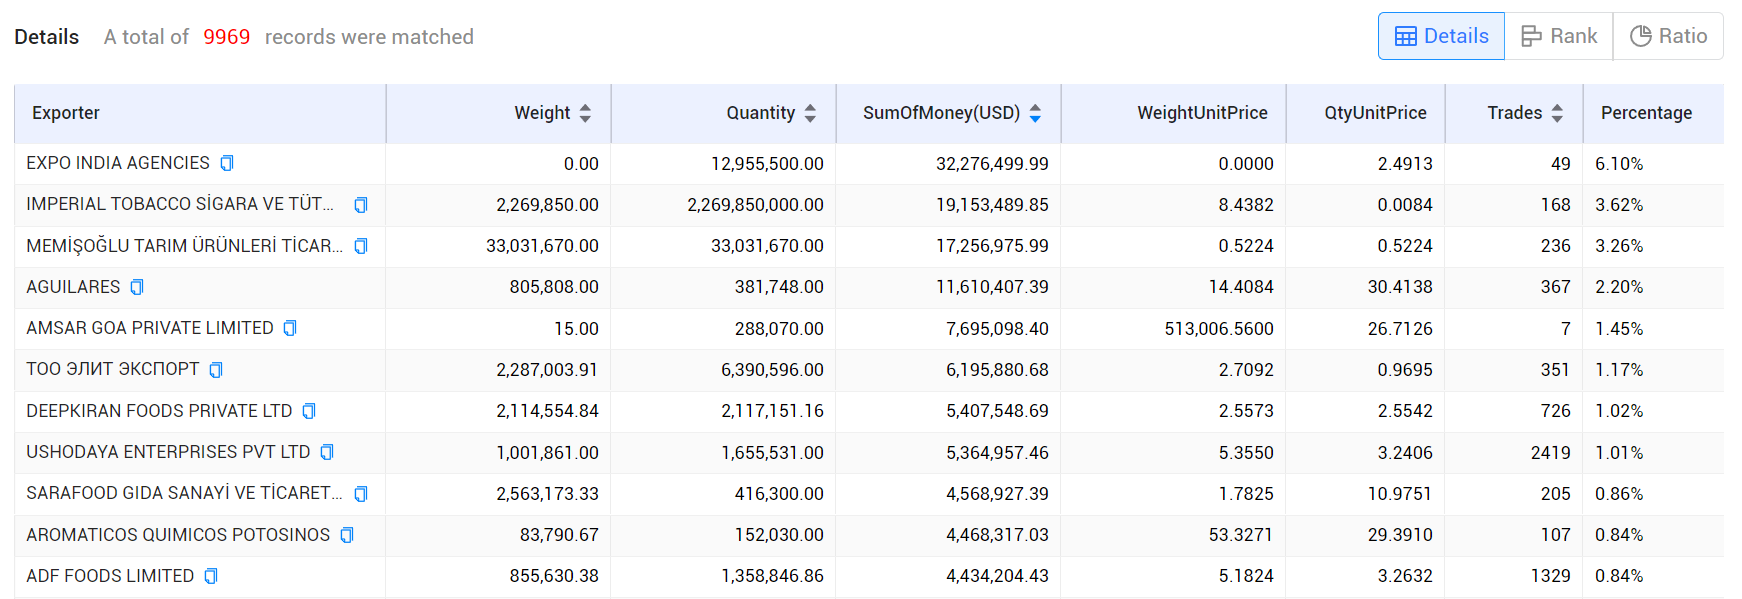
Tendata identifies the following suppliers as examples of garlic-exporting companies:
1. EXPO INDIA AGENCIES: 6.1%, $32.28 million
2. IMPERIAL TOBACCO SİGARA VE TÜTÜNCÜLÜK SANAYİ VE TİCARET ANONİM ŞİRKETİ: 3.62%, $19.15 million
3. MEMİŞOĞLU TARIM ÜRÜNLERİ TİCARET LİMİTED ŞİRKETİ: 3.26%, $17.26 million
4. AGUILARES: 2.2%, $11.61 million
5. AMSAR GOA PRIVATE LIMITED: 1.45%, $7.7 million
6. ТОО ЭЛИТ ЭКСПОРТ: 1.17%, $6.2 million
7. DEEPKIRAN FOODS PRIVATE LTD: 1.02%, $5.41 million
8. USHODAYA ENTERPRISES PVT LTD: 1.01%, $5.36 million
9. SARAFOOD GIDA SANAYİ VE TİCARET ANONİM ŞİRKETİ: 0.86%, $4.57 million
10. AROMATICOS QUIMICOS POTOSINOS: 0.84%, $4.47 million

Tendata iTrader compiles trade data from 218 countries and provides detailed
information on over 130 million import-export enterprises worldwide.
With a daily influx of 10 billion trade records, Tendata efficiently delivers contact details for over 700 million top-level executives and decision-makers in the import-export industry through advanced filtering. This includes email addresses, phone numbers, social media profiles, and more. Additionally, we offer synchronized company profiles, product images, and website links, along with 19 types of visual reports. These tools assist foreign trade enterprises in precise market positioning and thorough market analysis, enabling you to quickly find the exact buyers and suppliers you need.
(>> Visit the Official Shanghai Tendata Website for More Details <<)

Category
Leave Message for Demo Request or Questions


 T-info
 T-discovery

 My
Tendata
 Market Analysis
 Customer
Development
 Competitor
Monitoring
 Customer Relationship


