 Market Insights
 19-06-2024
In 2023, global exports of fresh or chilled salmon amounted to $24.2 billion.
The value of these exports increased by an average of 23.1% since 2018, when the total was $14.1 billion. Year over year, salmon exports rose by 28.9% from $17.2 billion in 2021.
Norway, Sweden, Chile, the United Kingdom, and Canada were the top five exporters of fresh or chilled salmon, together accounting for 84% of global sales in 2022.
Europe led the pack in 2022 with $14.9 billion in salmon exports, representing 86.6% of the global total. Latin American countries, including those in the Caribbean, followed with 6.1%, and North American countries contributed 5.2%.
Oceania (primarily Australia) provided 2%, Asia contributed 0.1%, and Africa just 0.001%.
There are two primary categories for fresh or chilled salmon exports:
- Atlantic or Danube salmon: $17 billion (98.9% of the global total)
- Pacific salmon: $189.2 million (1.1%)
In 2022, the leading importers of fresh or chilled salmon were Sweden, Poland, the United States, France, and Denmark, collectively buying over 55.1% of the global supply.
There are significantly more importing countries, islands, and territories than exporting ones—approximately 134 importers compared to about 60 exporters.
For research, the 6-digit Harmonized Tariff System code prefix is 030214 for Atlantic and Danube salmon, and 030213 for Pacific salmon.
Additionally, key statistics are provided for exports and imports of prepared or preserved salmon, whether whole or in pieces, under HTS code 160411.

Top Fresh or Chilled Salmon Exports by Country
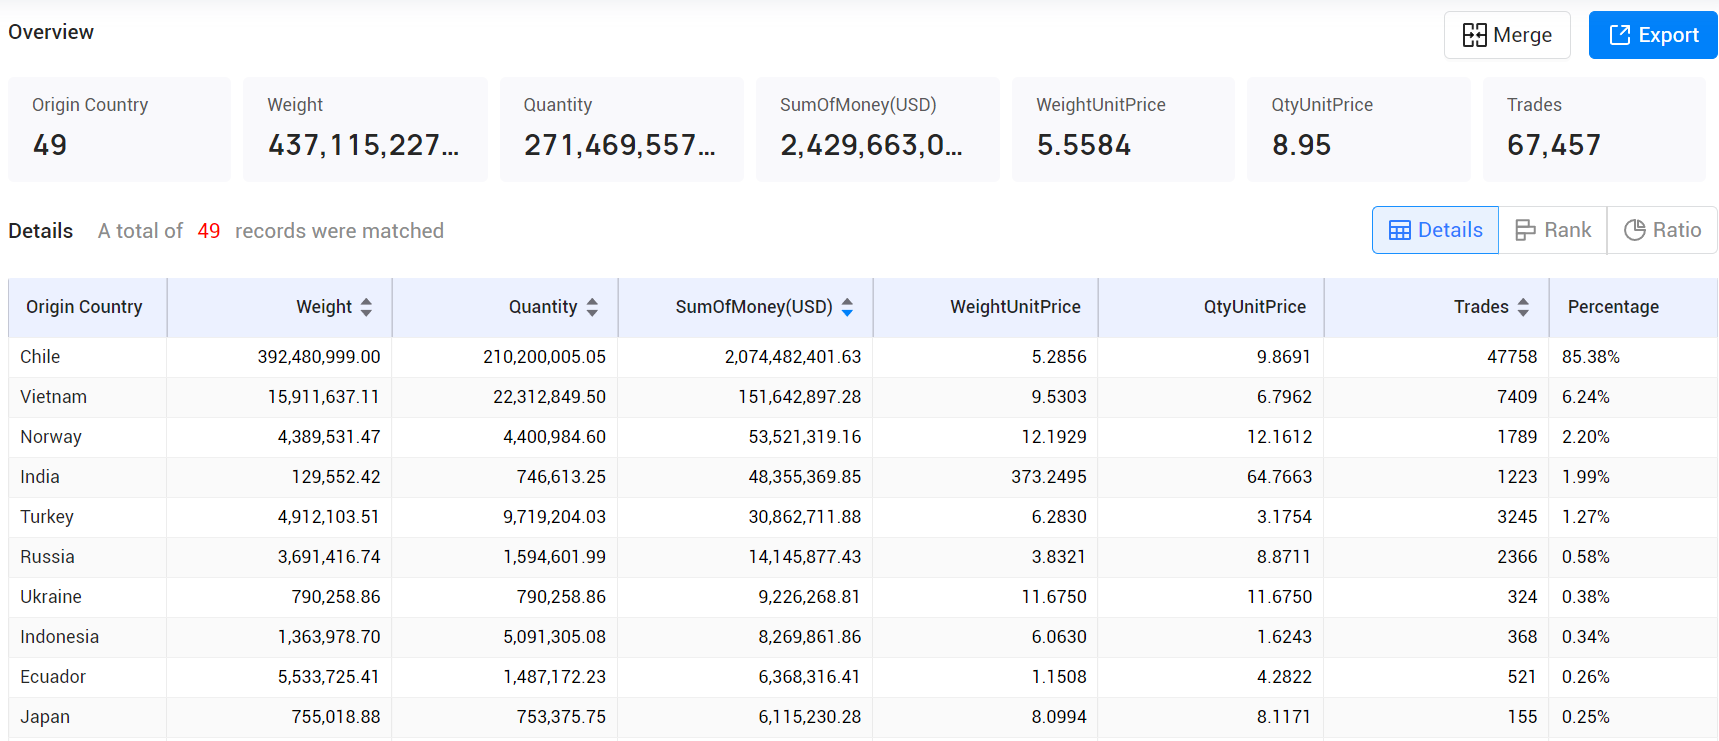
The top 10 countries exporting the highest value of fresh or chilled salmon in 2023 were:
1. Chile: 85.38% ($2,074.48 million)
2. Vietnam: 6.24% ($151.64 million)
3. Norway: 2.2% ($53.52 million)
4. India: 1.99% ($48.36 million)
5. Turkey: 1.27% ($30.86 million)
6. Russia: 0.58% ($14.15 million)
7. Ukraine: 0.38% ($9.23 million)
8. Indonesia: 0.34% ($8.27 million)
9. Ecuador: 0.26% ($6.37 million)
10. Japan: 0.25% ($6.12 million)
These 15 countries accounted for 99.4% of global salmon exports in 2022.
Among the top exporters, Finland (up 56.4%), Iceland (up 38.2%), the Netherlands (up 36.9%), and the United States (up 31%) showed the fastest growth since 2022.
Meanwhile, the United Kingdom (down 15.3%), France (down 14.4%), the Faroe Islands (down 6.7%), and Switzerland (down 4%) experienced declines.

Top Fresh or Chilled Salmon Imports by Country
Globally, salmon imports increased by 24.4% over five years starting in 2018, and by 27.1% year over year from 2021.
The top 15 countries importing salmon in 2022 were:
- Sweden: $3.8 billion (23.7% of total imports)
- United States: $1.5 billion (9.2%)
- Poland: $1.4 billion (8.9%)
- France: $1.2 billion (7.5%)
- Denmark: $936.9 million (5.8%)
- Brazil: $746.2 million (4.6%)
- China: $745.3 million (4.6%)
- United Kingdom: $683.9 million (4.2%)
- Italy: $516 million (3.2%)
- Spain: $512.6 million (3.2%)
- Germany: $478.1 million (3%)
- Netherlands: $467.3 million (2.9%)
- Finland: $387.8 million (2.4%)
- South Korea: $313.2 million (1.9%)
- Lithuania: $302.8 million (1.9%)
These countries accounted for 86.9% of global salmon imports in 2022.
The fastest-growing salmon importers since 2021 included the Netherlands (up 53.3%), Finland (up 29.2%), mainland China (up 25%), and Brazil (up 22.3%).
Notable declines were seen in the United Kingdom (down 17.2%) and France (down 2.7%).
Main Prepared or Preserved Salmon Exports by Country
In 2022, $899.4 million worth of prepared or preserved salmon was exported, accounting for 5.2% of the total value of fresh or chilled salmon exports, down from 5.4% in 2021.
The top 15 countries exporting prepared or preserved salmon were:
- United States: $155.9 million (19% of total)
- Poland: $153.3 million (18.7%)
- Thailand: $123.8 million (15.1%)
- Germany: $63.1 million (7.7%)
- Vietnam: $52.1 million (6.4%)
- Canada: $42.7 million (5.2%)
- Denmark: $39.3 million (4.8%)
- France: $26.7 million (3.3%)
- China: $26 million (3.2%)
- Chile: $24.9 million (3%)
- Ireland: $18.1 million (2.2%)
- Sweden: $16.3 million (2%)
- Netherlands: $15.2 million (1.9%)
- Belgium: $15.1 million (1.8%)
- Portugal: $7.1 million (0.9%)
These countries made up 94.9% of global exports for prepared or preserved salmon in 2022.
Among the fastest-growing exporters were Ireland (up 61.7%), Canada (up 52.9%), Latvia (up 42.9%), mainland China (up 37.5%), Chile (up 36.7%), and Denmark (up 34.3%).
Significant declines were recorded in France (down 35.6%), Germany (down 16.8%), Vietnam (down 7.6%), and Poland (down 7.6%).
Main Prepared or Preserved Salmon Imports by Country
In 2022, global imports of prepared or preserved salmon were valued at $1.027 billion, a 4.6% increase from 2021 and a 30.9% rise over five years starting in 2018.
The value of imported prepared or preserved salmon represented 6.3% of the total value for fresh or chilled salmon imports, slightly down from 6.6% in 2021.
The top 15 importers were:
- Germany: $240.3 million (23.4% of total)
- United States: $162 million (15.8%)
- Canada: $119.5 million (11.6%)
- Japan: $97.7 million (9.5%)
- United Kingdom: $95.4 million (9.3%)
- Australia: $52.2 million (5.1%)
- France: $30.2 million (2.9%)
- Italy: $27.8 million (2.7%)
- Belgium: $26.8 million (2.6%)
- Sweden: $22.9 million (2.2%)
- Taiwan: $15.3 million (1.5%)
- Switzerland: $13.8 million (1.3%)
- Denmark: $13.3 million (1.3%)
- Netherlands: $12.5 million (1.2%)
- Austria: $10.6 million (1%)
These countries accounted for 91.5% of global imports of prepared or preserved salmon in 2022.
Among the fastest-growing importers were Taiwan (up 86% from 2021), the United States (up 31.2%), Australia (up 31.1%), Italy (up 15.8%), and Denmark (up 15.1%).
Significant declines were noted in the Netherlands (down 24.4%) and Austria (down 11.9%).
Global Market Analysis
Analysis of the Overall Trade Situation and Trends in the Industry
Through its powerful digital platform and in-depth reporting services, Tendata helps users to analyse the overall situation and future trends of the industry, so as to achieve more accurate market positioning and strategic planning.

Analysis of Specific Product Trade Trends in the Target Market
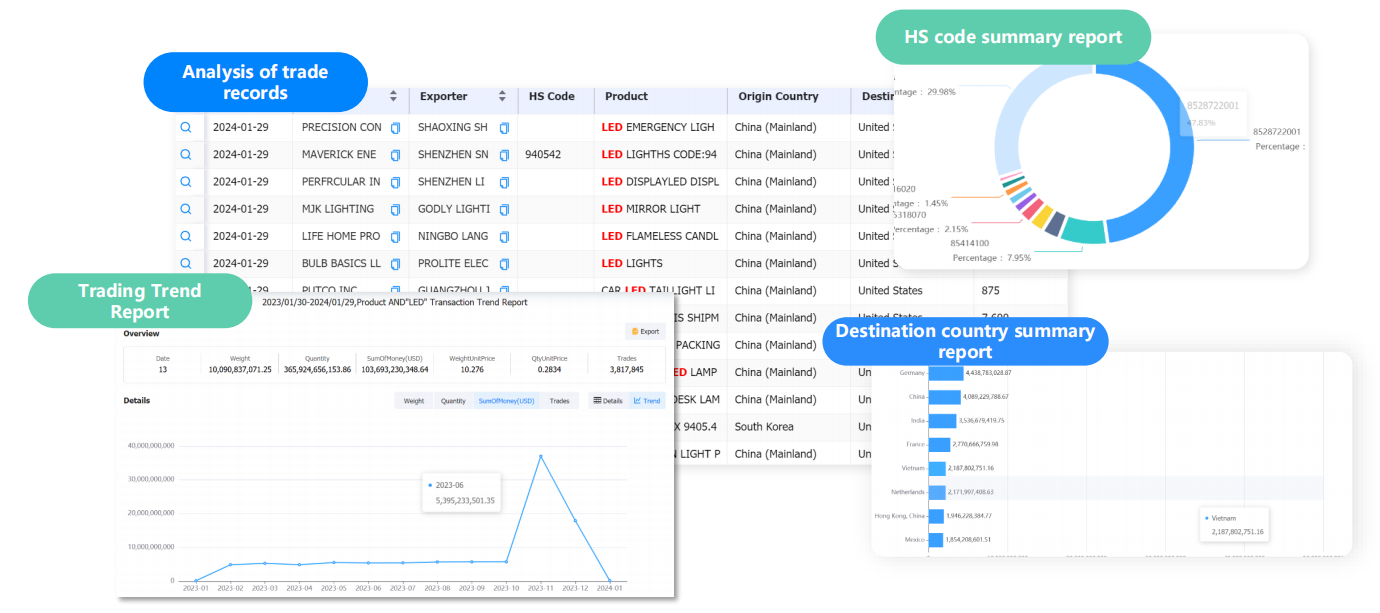
Tendata can provide comprehensive data support and analytical reports for analysing trade trends for a product in a single market, helping you to understand how that product is being traded in that market and identify business opportunities.

Category
Leave Message for Demo Request or Questions


 T-info
 T-discovery

 My
Tendata
 Market Analysis
 Customer
Development
 Competitor
Monitoring
 Customer Relationship


