 Market Insights
 19-06-2024
In 2022, the total value of globally exported food products reached an impressive $1.639 trillion.
This amount accounts for 6.7% of the total worldwide exports, marking a 45.8% increase from the $1.124 trillion recorded a decade earlier in 2012 when the food-to-total exports ratio stood at 6.1%.
From 2021 to 2022, the global food export value rose by 8.4%.
Comparatively, the overall value of all exported goods grew by 33.1% over the same ten-year period, with a faster year-over-year increase of 10.6% from 2021 to 2022, surpassing the 8.4% growth rate for food exports.
Given the global population of 8 billion in 2022, the $1.639 trillion in food exports translates to approximately $205 per person, which is a 30.2% increase from the $157 per person average in 2012 and a 6.9% rise from 2021.

Top Food Export Categories
Below is a ranking of the 17 leading food export categories by total sales in 2022, along with their respective dollar values and percentage shares of global food exports:
· Cereals: $176.3 billion (10.8%)
· Animal/vegetable fats, oils, waxes: $174 billion (10.6%)
· Meat: $164 billion (10%)
· Oil seeds: $152.1 billion (9.3%)
· Fish: $146.8 billion (9%)
· Fruits, nuts: $136.3 billion (8.3%)
· Dairy, eggs, honey: $111.4 billion (6.8%)
· Miscellaneous food preparations: $98.2 billion (6%)
· Cereal/milk preparations: $95.8 billion (5.8%)
· Vegetables: $83.2 billion (5.1%)
· Vegetable/fruit/nut preparations: $77.4 billion (4.7%)
· Meat/seafood preparations: $61.7 billion (3.8%)
· Sugar, sugar confectionery: $56.7 billion (3.5%)
· Cocoa: $54.5 billion (3.3%)
· Milling products, malt, starches: $27.3 billion (1.7%)
· Miscellaneous animal-origin products: $12 billion (0.7%)
· Gums, resins, other vegetable saps: $11.1 billion (0.7%)
Fourteen of these categories saw an increase in value from 2021 to 2022. Notably, vegetable saps including gums and resins and oil seeds showed the fastest growth, each up by 19.2%. Animal or vegetable fats, oils, and waxes improved by 16.9%, and sugar, including sugar confectionery, increased by 15.7%. Other significant gains were observed in cereals (up 15.5%), milling products, malt, and starches (up 15%), and fish (up 9.8%).
Conversely, three categories experienced declines: fruits and nuts (down 6.7%), cocoa (down 3.7%), and vegetables (down 0.2%).
Key Food Export Insights by Category
1. Cereals Exports
The top 8 cereals by global sales in 2022 were:
· Wheat and meslin: $66.2 billion (37.5%)
· Maize or corn: $62.5 billion (35.4%)
· Rice: $29.3 billion (16.6%)
· Barley: $9.9 billion (5.6%)
· Grain sorghum: $3.6 billion (2%)
· Miscellaneous cereals: $1.3 billion (0.7%)
· Oats: $1.2 billion (0.7%)
· Rye: $489.6 million (0.3%)
Significant year-over-year growth was seen in corn (up 21.1%), wheat and meslin (up 16.6%), oats (up 15.5%), and grain sorghum (up 10.8%). However, rye (down 10.1%) and barley (down 9%) faced declines.
Leading cereal exporting countries included the United States ($31.6 billion), Argentina ($14.4 billion), India ($14.1 billion), Brazil ($13.9 billion), and Australia ($13.8 billion).
2. Animal or Vegetable Fats and Oils Exports
Top subcategories for fats and oils in 2022 were:
· Palm oil: $55.5 billion (28.4%)
· Sunflower, safflower, or cotton-seed oils: $20.9 billion (9.9%)
· Soya-bean oil: $17.2 billion (9.4%)
· Rape, colza, or mustard oil: $14 billion (7.1%)
· Boiled/oxidized/dehydrated/sulfurized fats and oils: $10.2 billion (4%)
· Olive oil: $10 billion (5%)
· Margarine: $9.9 billion (4.7%)
The most significant gains were in boiled/oxidized/dehydrated/sulfurized oils (up 69.9%), soya-bean oil (up 68.2%), rape/colza/mustard oil (up 56.8%), and margarine (up 40.4%). Palm oil saw a modest 12.2% increase.
Top exporting countries were Indonesia ($35.2 billion), Malaysia ($23.7 billion), Netherlands ($8.4 billion), Argentina ($7.8 billion), and Spain ($7.6 billion).
3. Meat Exports
Key meat categories by global sales in 2022 included:
· Frozen beef: $38.7 billion (23.6%)
· Poultry meat: $35.5 billion (21.6%)
· Swine meat: $33.7 billion (20.6%)
· Fresh or chilled beef: $29.5 billion (18%)
· Red meat offal: $9.4 billion (5.8%)
· Sheep or goat meat: $9.4 billion (5.7%)
· Salted, dried, or smoked offal: $5.2 billion (3.2%)
· Pig or poultry fat: $812.7 million (0.5%)
· Rabbit or pigeon meat: $772.4 million (0.5%)
· Horse or donkey meat: $343.8 million (0.2%)
Frozen beef (up 25.4%), poultry meat (up 18.1%), and rabbit or pigeon meat (up 11.7%) saw notable increases, while swine meat (down 8.4%) and pig or poultry fat (down 8.3%) declined.
Leading meat exporters were Brazil ($24 billion), United States ($23.3 billion), Australia ($12 billion), Netherlands ($11.5 billion), and Spain ($9.9 billion).
4. Oil Seeds Exports
Major oil seed categories in 2022 were:
· Soya beans: $75.2 billion (61.7%)
· Rapeseeds or colza seeds: $14.7 billion (11.5%)
· Sowing seeds, fruits, spores: $8.7 billion (5.5%)
· Sunflower seeds: $4.7 billion (4.4%)
· Miscellaneous oil seeds: $5.4 billion (3.7%)
· Fodder roots, alfalfa, clover: $3.6 billion (2.7%)
· Plants, plant parts: $3.9 billion (2.6%)
· Uncooked groundnuts: $4.3 billion (2.6%)
· Locust beans, seaweeds: $2.5 billion (1.9%)
· Linseed: $1.4 billion (1%)
· Flours, meals of oil seeds: $1.6 billion (1%)
· Hop cones: $806.8 million (0.5%)
· Cereal straw, husks: $412.1 million (0.3%)
· Copra: $101.2 million (0.1%)
Sunflower seeds (up 43.7%), soya beans (up 24.7%), rapeseed/colza seeds (up 19.6%), and linseed (up 17.6%) showed strong gains. Uncooked groundnuts experienced a decline (down 8.7%).
Top exporters included Brazil ($47.2 billion), United States ($40.2 billion), Canada ($8.1 billion), Australia ($6.1 billion), and Argentina ($4.2 billion).
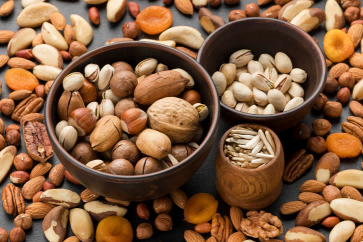
5. Fruits and Nuts Exports
Leading fruit and nut categories by export revenue in 2022 were:
· Fresh berries: $24.3 billion (16.4%)
· Miscellaneous nuts: $20.3 billion (13.4%)
· Dates/pineapples/mango/avocado: $16.7 billion (11.4%)
· Fresh or dried citrus fruit: $16.4 billion (10.7%)
· Bananas, plantains: $13.5 billion (9.2%)
· Grapes (fresh or dried): $11.4 billion (8.3%)
· Apples, pears (fresh): $10.9 billion (6.7%)
· Cherries/peaches/plums (fresh): $7.6 billion (5.5%)
· Fresh melons, papayas: $6.4 billion (5.1%)
· Coconuts, Brazil nuts, cashews: $4.7 billion (3.2%)
Exports of fresh berries (up 19.6%), fresh citrus fruits (up 18.9%), and miscellaneous nuts (up 16.8%) saw substantial growth. However, the value of banana and plantain exports declined (down 6.3%).
Top exporting countries were Mexico ($13.6 billion), Spain ($10.4 billion), United States ($9.1 billion), Chile ($8.7 billion), and Netherlands ($6.2 billion).
Tendata iTrader compiles trade data from 218 countries and provides detailed
information on over 130 million import-export enterprises worldwide.
With a daily influx of 10 billion trade records, Tendata efficiently delivers contact details for over 700 million top-level executives and decision-makers in the import-export industry through advanced filtering. This includes email addresses, phone numbers, social media profiles, and more. Additionally, we offer synchronized company profiles, product images, and website links, along with 19 types of visual reports. These tools assist foreign trade enterprises in precise market positioning and thorough market analysis, enabling you to quickly find the exact buyers and suppliers you need.
(>> Visit the Official Shanghai Tendata Website for More Details <<)

Category
Leave Message for Demo Request or Questions


 T-info
 T-discovery

 My
Tendata
 Market Analysis
 Customer
Development
 Competitor
Monitoring
 Customer Relationship


