 Import News
 23-12-2024
In 2023, global imports of pumpkins totaled $1.72 billion USD, reflecting a notable increase from the $1.42 billion USD recorded in 2019, marking a growth of 20.5% over the past four years.
However, compared to the previous year, pumpkin imports saw a slight decline of -0.5% from $1.73 billion USD in 2022.
The top five pumpkin importing nations, including the United States, France, Germany, the United Kingdom, and the Netherlands, together accounted for 62.2% of the global pumpkin import market in 2023.
From a regional perspective, European countries led the charge, contributing nearly three-fifths (56.5%) of the total global expenditure on pumpkins, with imports valued at $969.1 million USD. North American importers, primarily the United States, ranked second, accounting for 33.1% of global pumpkin imports. Meanwhile, Asia accounted for 9.7% of the world's pumpkin imports.
Other regions like Africa, Latin America (excluding Mexico but including the Caribbean), and Oceania (led by New Zealand) recorded smaller import volumes, with Africa at 0.31%, Latin America at 0.28%, and Oceania at 0.16%.
For reference, the six-digit Harmonized Tariff System (HTS) code for fresh or chilled pumpkins and similar gourds is 070993.

Top Companies Importing Pumpkins in 2023
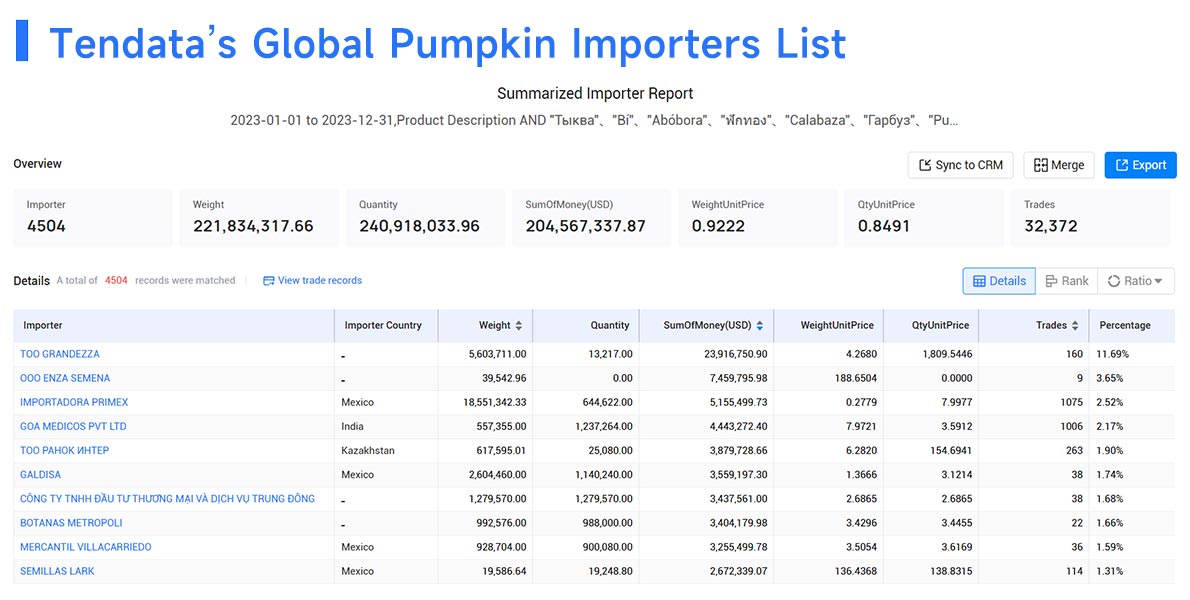
In Tendata Trade Data System, the leading companies in the global pumpkin import market for 2023 include:
1. ТОО GRANDEZZA – 11.69%, $23.92 Million
2. ООО ENZA SEMENA – 3.65%, $7.46 Million
3. IMPORTADORA PRIMEX – 2.52%, $5.16 Million
4. GOA MEDICOS PVT LTD – 2.17%, $4.44 Million
5. ТОО РАНОК ИНТЕР – 1.9%, $3.88 Million
6. GALDISA – 1.74%, $3.56 Million
7. CÔNG TY TNHH ĐẦU TƯ THƯƠNG MẠI VÀ DỊCH VỤ TRUNG ĐÔNG – 1.68%, $3.44 Million
8. BOTANAS METROPOLI – 1.66%, $3.4 Million
9. MERCANTIL VILLACARRIEDO – 1.59%, $3.26 Million
10. SEMILLAS LARK – 1.31%, $2.67 Million
>>Get More Data Samples from Tendata<<

Top 15 Pumpkin Importing Countries in 2023
The following 15 countries spent the most on importing pumpkins in 2023:
1.United States: $500 million (29.1% of global imports)
2.France: $196.7 million (11.5%)
3.Germany: $171.2 million (10%)
4.United Kingdom: $106.9 million (6.2%)
5.Netherlands: $94 million (5.5%)
6.Canada: $65.4 million (3.8%)
7.Japan: $61.4 million (3.6%)
8.Italy: $52.2 million (3%)
9.Belgium: $38.1 million (2.2%)
10.Poland: $35 million (2%)
11.Switzerland: $33.8 million (2%)
12.Russia: $32.3 million (1.9%)
13.Spain: $31 million (1.8%)
14.Austria: $29.1 million (1.7%)
15.Singapore: $22.9 million (1.3%)
Together, these 15 countries represent 85.6% of the total value of pumpkins imported globally in 2023.
Growth and Decline in Pumpkin Imports by Country
Among the top 15 pumpkin importing nations, some have seen significant growth since 2019. Notable examples include:
1.Switzerland, which experienced a remarkable increase of 868.4%.
2.Italy, up 71.4%.
3.Poland, which saw a rise of 66.9%.
4.Netherlands, up by 39%.
On the other hand, there were declines in imports from Japan (down -18.1% from 2019) and Russia (down -15.3%), reflecting a slowdown in demand or shifting market conditions in those regions.

Conclusion
The global market for pumpkins saw steady growth in 2023, with key importers continuing to dominate the landscape. European countries, particularly the United States, France, and Germany, accounted for the lion's share of pumpkin imports. Meanwhile, countries like Switzerland, Italy, and Poland have shown impressive growth in their pumpkin import activities.
With pumpkin consumption rising globally, particularly in the context of seasonal festivities, food processing, and culinary uses, the import market is poised for continued growth in the coming years, with varying trends in specific regions.
Category
Leave Message for Demo Request or Questions


 T-info
 T-discovery

 My
Tendata
 Market Analysis
 Customer
Development
 Competitor
Monitoring
 Customer Relationship


