 Import News
 13-11-2024
The European Union (EU) has long been one of the largest and most diverse import markets in the world. In 2023, the landscape of the European imports continued to evolve, shaped by factors such as post-pandemic economic recovery, geopolitical tensions, shifting consumer preferences, and a focus on sustainability.

European Union's imports 2023 by country
Top trading partners of European Union in 2023:
· China: 20%, 555 billion US$
· USA: 13.4%, 366 billion US$
· United Kingdom: 7.11%, 193 billion US$
· Switzerland: 5.59%, 151 billion US$
· Turkey: 3.78%, 102 billion US$
· Norway: 3.65%, 99 billion US$
· Korea: 2.89%, 78 billion US$
· Japan: 2.78%, 75 billion US$
· India: 2.57%, 70 billion US$
· Special Categories: 2%, 54 billion US$
>>Click here for more trade data<<
European Union's Top Imports in 2023:
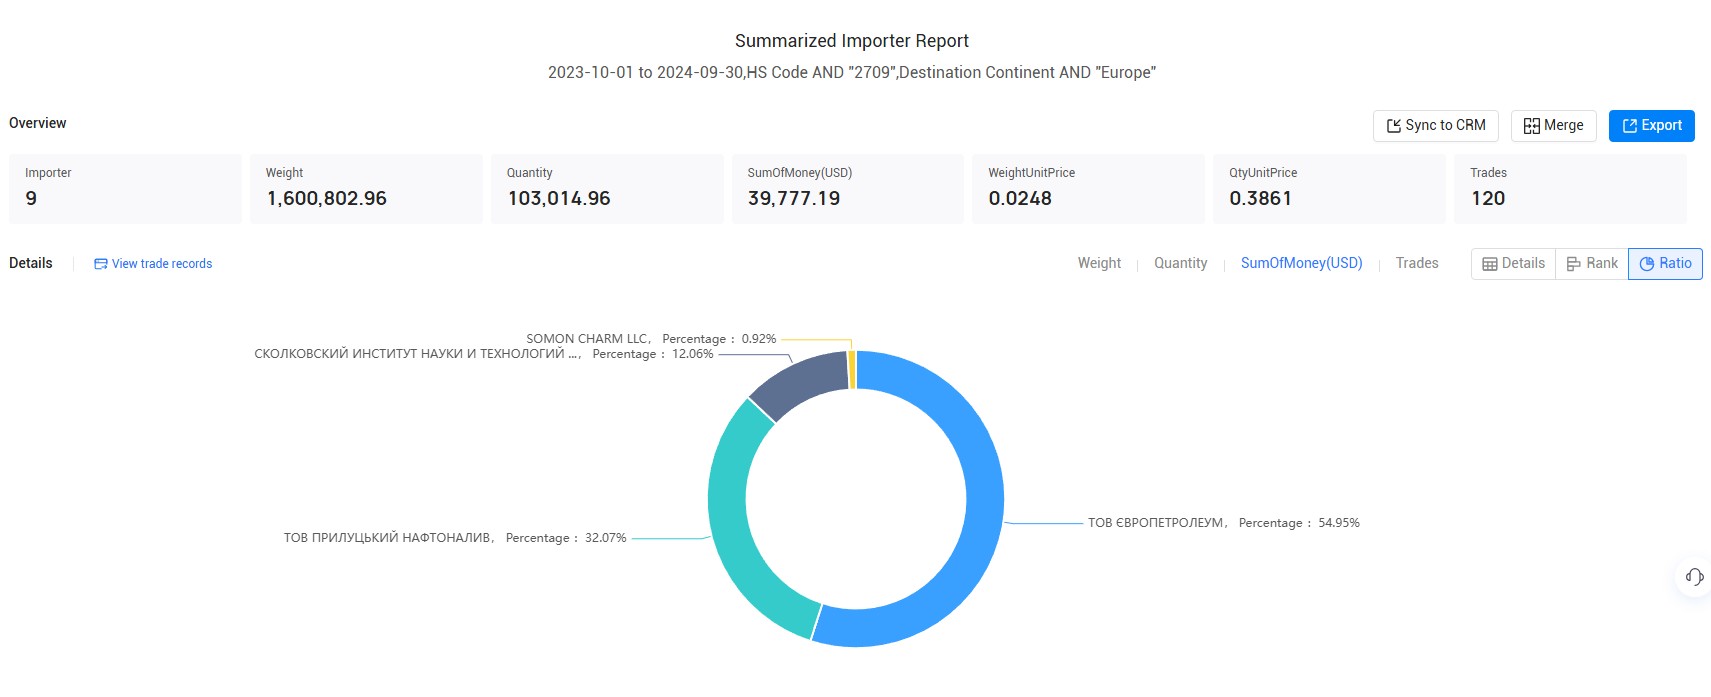
· HS Code 2709 (10.9%, $296 billion): Petroleum oils and oils obtained from bituminous minerals, crude
· HS Code 2711 (5.19%, $141 billion): Petroleum gases and other gaseous hydrocarbons
· HS Code 8517 (3.13%, $85 billion): Electrical apparatus for line telephony or line telegraphy, including line telephone sets with cordless handsets and telecommunication apparatus for carrier-current line systems or for digital line systems; videophones
· HS Code 8703 (3.11%, $84 billion): Motor cars and other motor vehicles principally designed for the transport of persons (other than those of heading 87.02), including station wagons and racing cars
· HS Code 2710 (2.96%, $80 billion): Petroleum oils and oils from bituminous minerals, not crude; preparations n.e.c. containing by weight 70% or more of petroleum oils or oils from bituminous minerals; these being the basic constituents of the preparations; waste oils
· HS Code 8471 (2.33%, $63 billion): Automatic data processing machines and units thereof; magnetic or optical readers, machines for transcribing data onto data media in coded form and machines for processing such data, not elsewhere specified or included
· HS Code 3002 (2.07%, $56 billion): Human blood; animal blood for therapeutic, prophylactic or diagnostic uses; antisera, other blood fractions, immunological products, modified or obtained by biotechnological processes; vaccines, toxins, cultures of micro-organisms (excluding yeasts) etc
· HS Code 8542 (1.81%, $49 billion): Electronic integrated circuits and microassemblies
· HS Code 3004 (1.79%, $48 billion): Medicaments (excluding goods of heading 30.02, 30.05 or 30.06) consisting of mixed or unmixed products for therapeutic or prophylactic uses, put up in measured doses (including those in the form of transdermal administration systems) or in forms or packings for retail sale
>>Contact Tendata for more information<<

About Tendata
Tendata based on big data, can take the initiative to deeply analyze the customer background, accurately locate the purchasers with transaction records, and can greatly screen and locate the big customers.
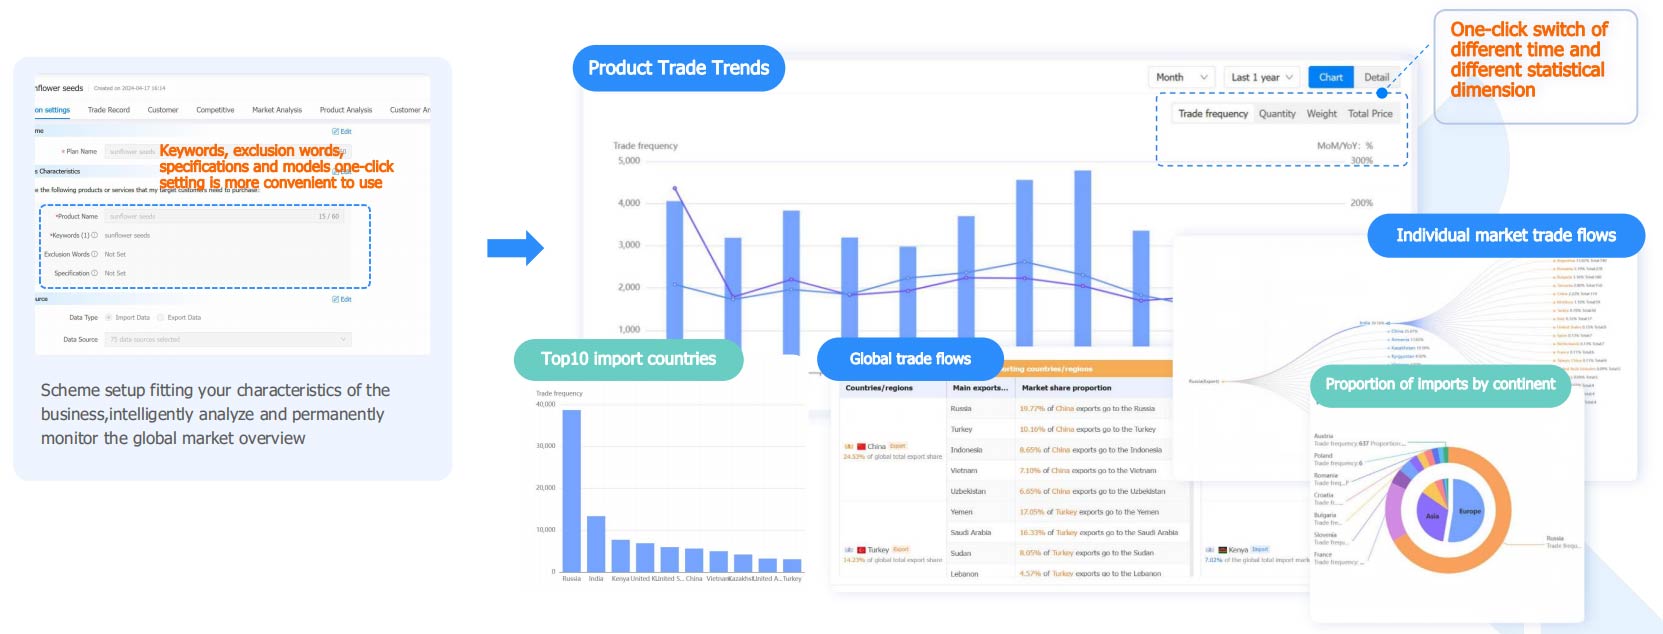
Tendata iTrader has 210 million global enterprise information, 10 billion data scrolling every day, can quickly and intelligently screen out 700 million executives, decision makers contact information, including email, phone, social media, etc., but also can synchronize the display of the company's yellow pages, product images and web site. At the same time, Tendata provides 19 visualization reports to help foreign trade enterprises accurately locate and analyze the market, so that you can quickly find the precise buyers and suppliers you need. >>Contact Tendata for a free demo<<

Key Import Trends in Europe
1. Energy Imports
The war in Ukraine reshaped Europe's energy landscape, leading to a shift away from Russian sources.
Natural Gas: EU imports fell by 25% to €100 billion, as Europe diversified suppliers to countries like the U.S., Norway, and Qatar.
Crude Oil: Imports totaled €250 billion, with a 5% increase from the Middle East and North America.
Renewable Energy Technologies: Solar panels and wind turbines saw a 12% rise in imports, supporting Europe's green transition.
2. Machinery and Equipment
Demand for high-tech machinery and industrial equipment remained strong in 2023.
Machinery Imports: €350 billion, a 4.2% increase from 2022, driven by automation, robotics, and EV components.
Germany: The key contributor, especially in engineering and advanced manufacturing.
3. Automobiles and Auto Parts
Despite supply chain issues, Europe's demand for automobiles and parts grew.
Automobile Imports: Valued at €150 billion, up 5.5% year-on-year.
Auto Parts: €100 billion, with key suppliers from Japan, South Korea, and the U.S.
Electric Vehicles: China emerged as a major exporter, reflecting Europe’s shift to sustainable transportation.
4. Chemicals and Pharmaceuticals
Europe's reliance on imported chemicals and pharmaceuticals grew in 2023.
Chemicals: Imports rose 6% to €250 billion.
Pharmaceuticals: €75 billion, with key suppliers including Switzerland, the U.S., and India.
Specialty Chemicals: Increased demand for formulations in cosmetics, agriculture, and food production.
5. Consumer Goods and Foodstuffs
With growing consumer demand, Europe’s imports of food and luxury goods continued to rise.
Food Imports: €130 billion, up 3.1%, including products from Brazil, the U.S., and Turkey.
Luxury Goods: €75 billion, driven by imports of fashion items, electronics, and cosmetics from China and India.
6. Technology and Electronics
Technology and electronics remained strong import categories, driven by digitalization.
Consumer Electronics: €90 billion, with China and South Korea as major exporters.
Semiconductors: Europe continued to import high volumes of chips to support its automotive and tech industries, amid global shortages.
Conclusion
The European imports in 2023 reflect a combination of recovery from the COVID-19 pandemic, geopolitical shifts, and evolving consumer trends. Energy, machinery, automobiles, and chemicals remained some of the largest categories, while the growing interest in electric vehicles, renewable energy, and technology demonstrated Europe's push toward sustainability and digital transformation.
Category
Leave Message for Demo Request or Questions


 T-info
 T-discovery

 My
Tendata
 Market Analysis
 Customer
Development
 Competitor
Monitoring
 Customer Relationship


