 Import News
 25-10-2024
In the first half of 2024, India imports showcased a diverse range of products, reflecting its growing economy and demand for various goods. Below is an overview of the main products imported by India during this period, along with the countries from which they were sourced.

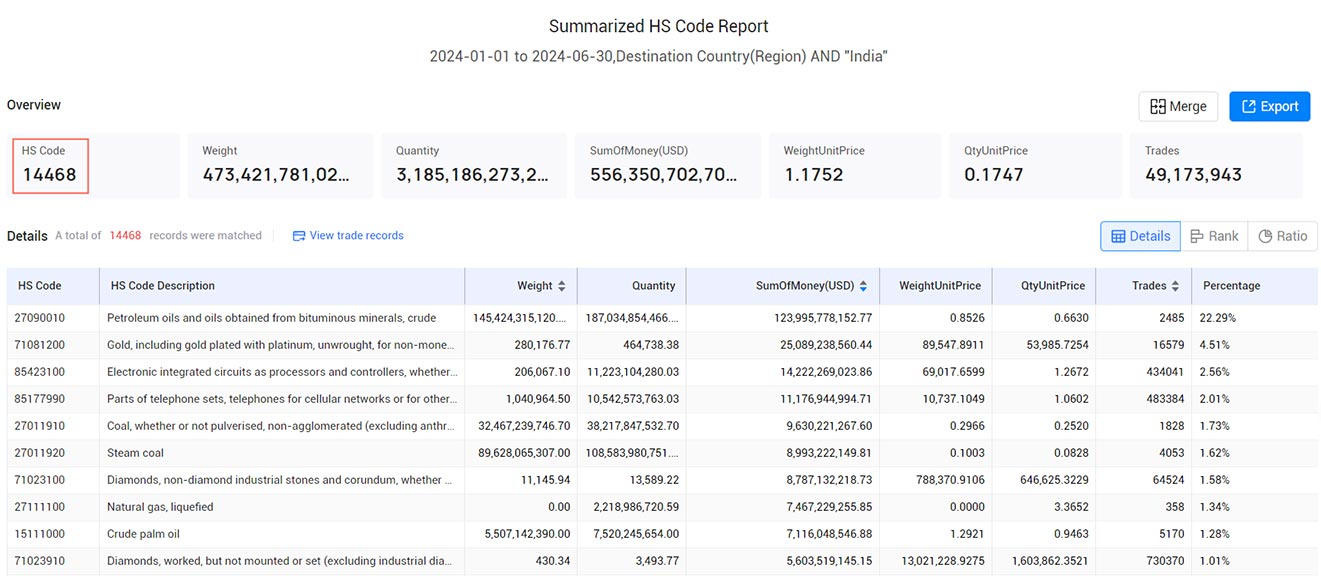
According to Tendata, main India imports and their HS codes in the first half of 2024 are:
1.HS Code:27090010(22.29%, $123995.78 Million):Petroleum oils and oils obtained from bituminous minerals, crude
2.HS Code:71081200(4.51%, $25089.24 Million):Gold, including gold plated with platinum, unwrought, for non-monetary purposes (excluding gold in powder form)
3.HS Code:85423100(2.56%, $14222.27 Million):Electronic integrated circuits as processors and controllers, whether or not combined with memories, converters, logic circuits, amplifiers, clock and timing circuits, or other circuits
4.HS Code:85177990(2.01%, $11176.94 Million):Parts of telephone sets, telephones for cellular networks or for other wireless networks and of other apparatus for the transmission or reception of voice, images or other data, n.e.s.
5.HS Code:27011910(1.73%, $9630.22 Million):Coal, whether or not pulverised, non-agglomerated (excluding anthracite and bituminous coal): Coking coal
6.HS Code:27011920(1.62%, $8993.22 Million):Steam coal
7.HS Code:71023100(1.58%, $8787.13 Million):Diamonds, non-diamond industrial stones and corundum, whether or not worked or simply sawn, cleaved or bruised; synthetic or cultured diamonds and other gemstones of natural, synthetic or cultured origin, unworked or simply sawn, cleaved or bruted
8.HS Code:27111100(1.34%, $7467.23 Million):Natural gas, liquefied
9.HS Code:15111000(1.28%, $7116.05 Million):Crude palm oil
10.HS Code:71023910(1.28%, $5603.52 Million):Diamonds, worked, but not mounted or set (excluding industrial diamonds)

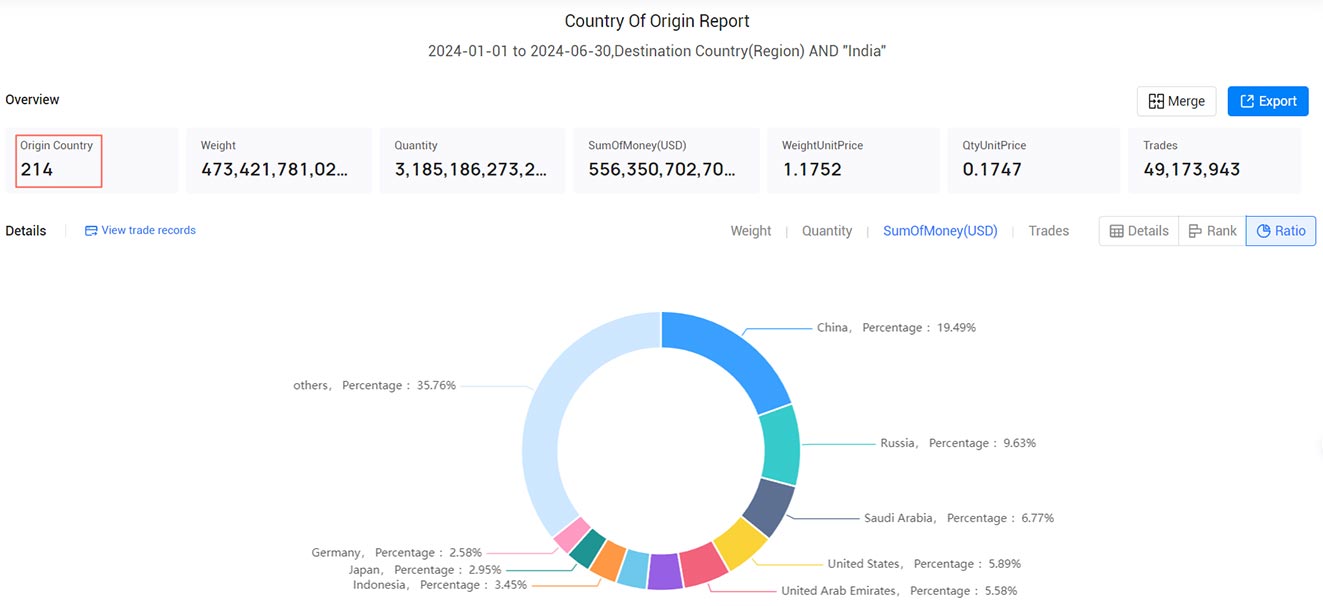
Key India Imports Countries
1.China(5.12%, $108424.92 Million)
2.Russia(54.79%, $53552.29 Million)
3.Saudi Arabia(94.89%, $37668.82 Million)
4.United States(78.57%, $32770.45 Million)
5.United Arab Emirates(61.99%, $31054.51 Million)
6.Iraq(55.95%, $23927.39 Million)
7.South Korea(45.88%, $20047.77 Million)
8.Indonesia(21.32%, $19203.47 Million)
9.Japan(22.52%, $16405.82 Million)
10.Germany(130.72%, $14355.51 Million)
>>>Contact Tendata Now<<<

In summary, India imports in the first half of 2024 consisted of a wide range of essential goods, primarily driven by energy needs, consumer demand, and industrial requirements. The strong trading relationships with key partner countries highlight India's strategic approach to securing resources and fostering economic growth. As global dynamics continue to shift, India imports landscape will likely evolve further, reflecting both domestic and international trends.
Category
Leave Message for Demo Request or Questions


 T-info
 T-discovery

 My
Tendata
 Market Analysis
 Customer
Development
 Competitor
Monitoring
 Customer Relationship


