 Export News
 11-03-2025
In 2023, international milk exports were valued at $32.1 billion, marking a 7.5% increase over the past five years from $29.8 billion in 2019.
However, compared to $38.5 billion in 2022, the value of international milk exports declined by 16.7% year-over-year.
The top five milk-exporting nations by revenue were New Zealand, Germany, the Netherlands, the United States, and Belgium. Collectively, these major dairy suppliers contributed 56.3% of international milk trade in 2023.
From a continental perspective, the majority of international milk shipments originated from European exporters, accounting for 57.2% of total sales.
Oceania came in second, with 24.8% of international milk exports, led by New Zealand.
North American suppliers contributed 8.8%, followed by Asia at 5%.
Latin America (excluding Mexico but including the Caribbean) held a 4.5% share, while Africa accounted for 1% of total milk exports.
Milk is classified into two major categories for international trade based on the Harmonized Tariff System (HTS):
· HTS Code 0401: Covers unsweetened milk and cream (not concentrated or containing added sugar).
· HTS Code 0402: Covers sweetened and concentrated milk and cream.
In 2023, exports of unsweetened milk under HTS 0401 amounted to $11.1 billion (34.5% of the total), while sweetened milk products under HTS 0402 generated $21 billion (65.5%).

Top 15 Milk Exporters in 2023
The table below ranks the 15 leading milk-exporting countries based on total export value, including both sweetened and unsweetened dairy products:
1.New Zealand – $6.8 billion (21.2% of total international milk exports)
2.Germany – $3.5 billion (10.8%)
3.Netherlands – $2.9 billion (8.9%)
4.United States – $2.6 billion (8.1%)
5.Belgium – $2.31 billion (7.2%)
6.France – $2.03 billion (6.3%)
7.Australia – $1.14 billion (3.5%)
8.Poland – $1.08 billion (3.4%)
9.Ireland – $1.07 billion (3.3%)
10.United Kingdom – $838.2 million (2.6%)
11.Czech Republic – $662.4 million (2.1%)
12.Uruguay – $608.1 million (1.9%)
13.Spain – $494 million (1.5%)
14.Austria – $484.1 million (1.5%)
15.Argentina – $406.4 million (1.3%)
Together, these 15 countries accounted for 83.7% of total international milk exports in 2023.
Trends in Milk Exports
Between 2019 and 2023, some nations experienced significant export growth, including:
· Ireland (+52.2%)
· Czech Republic (+44.3%)
· United States (+35.5%)
· Uruguay (+32.2%)
Meanwhile, countries with the smallest export growth rates included:
· United Kingdom (+4.6% since 2022)
·New Zealand (+8.9%)
·Milk Exporting Companies (2024)
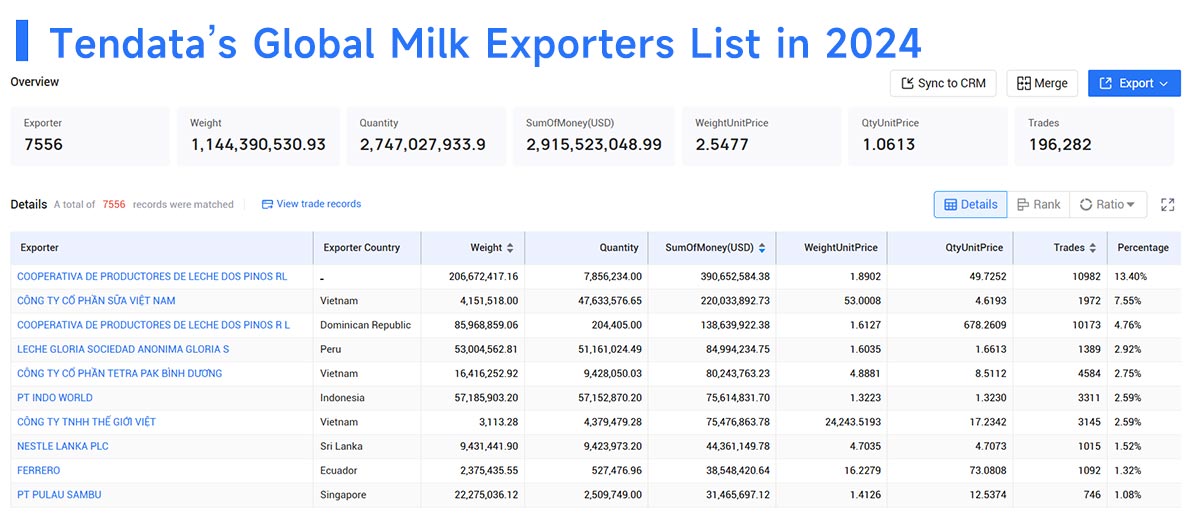
Leading Milk Exporting Companies (2024)
Here are some of the largest international milk-processing companies engaged in international dairy trade, according to Tendata:
1.COOPERATIVA DE PRODUCTORES DE LECHE DOS PINOS RL – $390.65 million (13.4%)
2.CÔNG TY CỔ PHẦN SỮA VIỆT NAM – $220.03 million (7.55%)
3.COOPERATIVA DE PRODUCTORES DE LECHE DOS PINOS R L – $138.64 million (4.76%)
4.LECHE GLORIA SOCIEDAD ANONIMA GLORIA S – $84.99 million (2.92%)
5.CÔNG TY CỔ PHẦN TETRA PAK BÌNH DƯƠNG – $80.24 million (2.75%)
6.PT INDO WORLD – $75.61 million (2.59%)
7.CÔNG TY TNHH THẾ GIỚI VIỆT – $75.48 million (2.59%)
8.NESTLÉ LANKA PLC – $44.36 million (1.52%)
9.FERRERO – $38.55 million (1.32%)
10.PT PULAU SAMBU – $31.47 million (1.08%)
These major players drive international dairy trade, supplying milk and processed dairy products across international markets.

Conclusion
Despite experiencing a decline in 2023, international milk exports remain a multi-billion-dollar industry, with Europe, Oceania, and North America as the primary suppliers.
Emerging dairy exporters such as Ireland, the Czech Republic, and Uruguay have shown strong growth, while longstanding dairy powerhouses like New Zealand and the U.S. continue to dominate the market.
As the international demand for dairy products evolves, monitoring export trends and key industry players will be essential for businesses looking to capitalize on international dairy trade. 🥛🚀
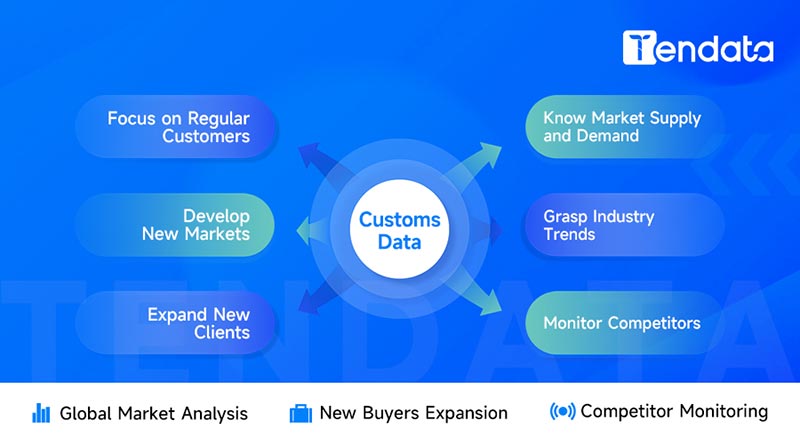
Tendata provides more than 10 billion trade data, covering 228 countries and regions, accumulating more than 10 billion trade transaction details, and a trade database of more than 230 sub-industries.
Searching product keywords or HS codes in Tendata iTrader will allow you to view tens of thousands of active potential customers in the past year, as well as customers' purchase records, including purchase amount, quantity, time, frequency, and their suppliers/buyers. These companies in the Customers List are all customers with needs, and can be used for foreign trade customer development.

Category
Leave Message for Demo Request or Questions


 T-info
 T-discovery

 My
Tendata
 Market Analysis
 Customer
Development
 Competitor
Monitoring
 Customer Relationship


