 Export News
 27-11-2024
In 2023, worldwide antibiotics exports reached a total value of $10.4 billion.
The value of antibiotics exports declined slightly by -2.9% from 2019, when total antibiotics exports were valued at $10.7 billion. Year over year, however, the global export value of antibiotics increased by 4%, compared to $10 billion in 2022.
Antibiotics exports, classified as organic chemicals, are essential medications used to treat bacterial infections. Contrary to widespread belief, antibiotics exports do not treat viral infections such as influenza or the common cold. In essence, antibiotics are not antiviral agents.
The five leading global exporters of antibiotics exports in 2023 were mainland China, the United States, India, Italy, and Switzerland. Together, these five countries accounted for nearly 75% of the total worldwide antibiotics exports.
From a continental perspective, Asia led the world in antibiotics exports in 2023, contributing $5.6 billion, or 53.8% of global antibiotics exports. Europe ranked second, contributing 33.3%, while North America made up 10.4% of antibiotics exports. Smaller shares came from Latin America (2.4%), Oceania (0.1%), and Africa (0.03%).
The Harmonized Tariff System (HTS) code prefix for antibiotics exports is 2609, commonly used for classification in trade data.

Leading Antibiotics Exporting Countries
The following is a list of the top 15 countries that exported the highest value of antibiotics exports in 2023:
1.Mainland China: $4.1 billion (39.2% of global antibiotics exports)
2.United States: $1.1 billion (10.4%)
3.India: $1 billion (9.7%)
4.Italy: $876 million (8.4%)
5.Switzerland: $749.7 million (7.2%)
6.Belgium: $415.1 million (4%)
7.Spain: $387.6 million (3.7%)
8.Denmark: $191.6 million (1.8%)
9.Panama: $189 million (1.8%)
10.South Korea: $180.4 million (1.7%)
11.Singapore: $160.7 million (1.5%)
12.France: $132.4 million (1.3%)
13.Netherlands: $118.9 million (1.1%)
14.Austria: $108.8 million (1%)
15.Hungary: $105.8 million (1%)
These 15 countries combined accounted for 97.2% of total global antibiotics exports in 2023.
Fastest-Growing Antibiotics Exporters
Among the top exporters, the countries with the most significant growth in antibiotics exports since 2022 included:
· Austria: +75,460%
· United States: +153.1%
· Panama: +31.3%
· Germany: +21.1%
On the other hand, some countries saw a decrease in their antibiotics exports:
· Japan: -51% from 2022
· Singapore: -36.6%
· Belgium: -21.7%
· Netherlands: -14.9%
Notable Antibiotics Exporting Companies
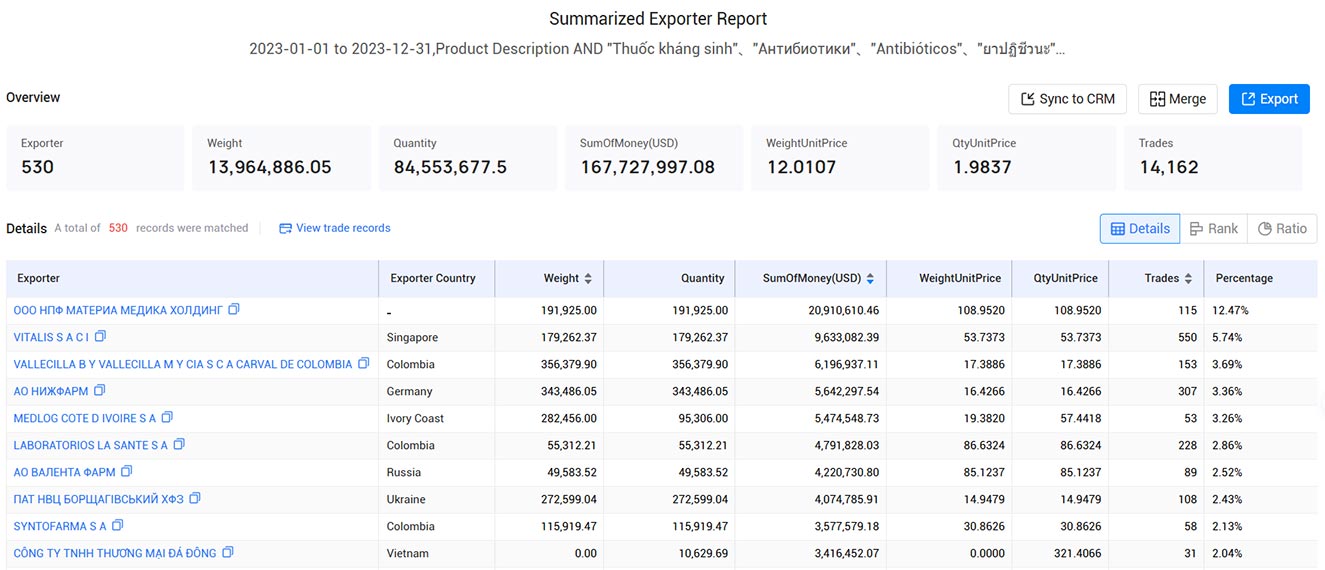
Several companies around the world are driving the antibiotics exports market. According the Tendata platform, below are the top exporters in the pharmaceutical industry by their share of total antibiotics exports:
1.ООО НПФ МАТЕРИА МЕДИКА ХОЛДИНГ: 12.47%, $20.91 million
2.VITALIS S A C I: 5.74%, $9.63 million
3.VALLECILLA B Y VALLECILLA M Y CIA S C A CARVAL DE COLOMBIA: 3.69%, $6.2 million
4.АО НИЖФАРМ: 3.36%, $5.64 million
5.MEDLOG COTE D IVOIRE S A: 3.26%, $5.47 million
6.LABORATORIOS LA SANTE S A: 2.86%, $4.79 million
7.АО ВАЛЕНТА ФАРМ: 2.52%, $4.22 million
8.ПАТ НВЦ БОРЩАГІВСЬКИЙ ХФЗ: 2.43%, $4.07 million
9.SYNTOFARMA S A: 2.13%, $3.58 million
10.CÔNG TY TNHH THƯƠNG MẠI ĐÁ ĐÔNG: 2.04%, $3.42 million
>>Get A FREE DEMO from Tendata<<

Conclusion
In 2023, antibiotics exports continued to play a significant role in global trade, with a few countries dominating the market. The overall increase in antibiotics export values reflects global demand for these essential medications. Mainland China, the United States, and India are major players in the antibiotics export industry, with Austria and Panama showing impressive growth.
For businesses looking to understand the dynamics of global antibiotics exports, exploring the export data and understanding the trends in the pharmaceutical industry is essential. By keeping track of these changes, companies can better navigate the competitive landscape and make informed decisions about their international trade strategies.
Customs data contains a vast amount of information, and extracting relevant
customer contact information can be time-consuming, with results not always
meeting expectations. Is it truly the case, or is it because customs data is
being used incorrectly, resulting in wasted effort and time?
Utilizing customs data for customer development can be achieved by precisely characterizing all buyers and their procurement systems in the target market. This allows for the quick identification of the most compatible customers, discerning their credit systems and procurement information, determining high-quality customers and profit margins, enhancing development efficiency, and improving overall effectiveness.
In customs data, one can observe the suppliers of buyers. Some of these suppliers are trade companies and also potential customers. In-depth analysis can be conducted on these trade companies, and key customers can be selected for focused development. Information such as buyer contacts, trade partners, procurement cycles, and purchase volumes can be obtained. While customs data may lack contact information due to being derived from bill of lading information, Tendata iTrader provides not only customs data but also business and internet data. This allows for the direct extraction of contact information and positions based on buyer names, making customer development through customs data seamless. (>>> Click To Get Free Demo for Customs Data From 100+ Countries) For new customer development using customs data, three strategies are available for consideration.

Category
Leave Message for Demo Request or Questions


 T-info
 T-discovery

 My
Tendata
 Market Analysis
 Customer
Development
 Competitor
Monitoring
 Customer Relationship


