 Market Insights
 2024-06-28
In 2022, global fig exports totaled approximately $590.7 million. Since 2018, the overall value of exported figs has remained relatively stable, with a slight increase of 1.2% from $583.5 million. However, year-over-year figures show a significant decline of 22.8% from $765.4 million in 2021.
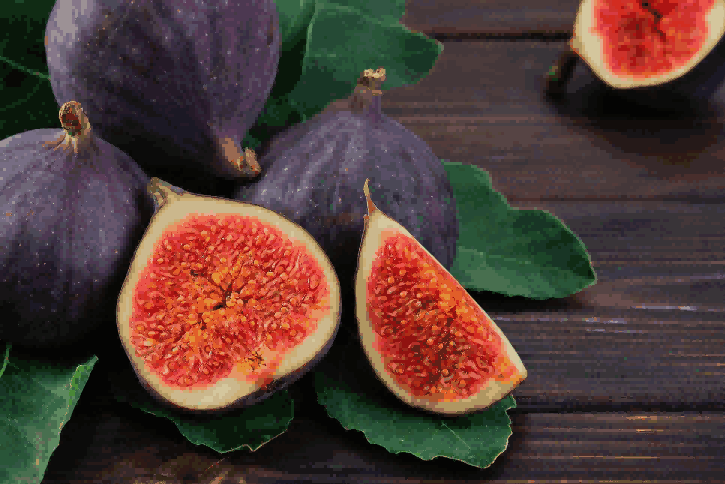
Figs, which come from small flowering trees with white bark, are consumed fresh, dried, or processed into various products such as jams, biscuits, and desserts.
The top five fig-exporting countries—Türkiye, Afghanistan, Austria, Germany, and the Netherlands—accounted for about 75.5% of the global fig export market in 2022.
From a regional perspective, Asian countries led fig exports with $415.1 million (70.3% of the global total). European exporters followed with 23.8%. North America (2.9%), Latin America (2.5%) excluding Mexico but including the Caribbean, Africa (0.4%), and Oceania (0.1%) primarily Australia, had smaller shares.

Top Fig Importers by Country in 2022
The leading fig-importing countries in 2022 were Germany, India, France, the United States, and Austria. Together, these nations purchased 44.1% of the world's imported figs.
This data suggests a higher concentration of exporters (75.5% from the top five exporters) compared to a broader range of 170 importing countries, islands, and territories, with the top five importers accounting for less than half (44.1%) of the total imports.
Europe received 55.4% of the total fig imports, followed by Asia (27.5%), North America (13.3%), Africa (1.9%), Oceania (1.6%) mostly Australia and New Zealand, and Latin America (0.4%) excluding Mexico but including the Caribbean.
Globally, the average price paid by fig importers was $4,443 per ton in 2022, reflecting a 10.4% increase from $4,023 per ton in 2021.
For reference, the 6-digit Harmonized Tariff System code for fresh or dried figs is 080420.
Top Fig Exporters by Country in 2022
Below are the top 15 countries by the value of figs exported in 2022:
1. Türkiye: $307 million (52% of total exported figs)
2. Afghanistan: $68.2 million (11.5%)
3. Austria: $29 million (4.9%)
4. Germany: $21 million (3.6%)
5. Netherlands: $20.6 million (3.5%)
6. Iran: $20.1 million (3.4%)
7. Spain: $19.7 million (3.3%)
8. Greece: $16.4 million (2.8%)
9. United States: $9.8 million (1.7%)
10. Peru: $7.4 million (1.2%)
11. Italy: $7.3 million (1.2%)
12. Mexico: $6.9 million (1.2%)
13. France: $6.8 million (1.1%)
14. Brazil: $6.3 million (1.1%)
15. Syria: $5.8 million (1%)
These 15 countries accounted for 93.5% of global fig exports in 2022. Notable increases in export value were seen in Austria (up 20.7% from 2021), Greece (up 10.3%), and Peru (up 9.2%). Significant declines were observed in Afghanistan (down 59.3%), Iran (down 50.2%), Syria (down 46.5%), Italy (down 36.4%), and France (down 29.9%).
Leading Fig Importing Countries in 2022
The cost of imported figs increased by 6.3% over the five-year period starting in 2018 but decreased by 17.6% year-over-year from 2021.
Below are the top 15 countries by the value of figs imported in 2022:
1. Germany: $68.6 million (10.7% of total imported figs)
2. India: $65.3 million (10.2%)
3. France: $57.9 million (9.1%)
4. United States: $55 million (8.6%)
5. Austria: $35.3 million (5.5%)
6. Canada: $29.9 million (4.7%)
7. United Kingdom: $28.1 million (4.4%)
8. Netherlands: $23.1 million (3.6%)
9. Italy: $22.8 million (3.6%)
10. China: $21.2 million (3.3%)
11. Switzerland: $20.2 million (3.2%)
12. Russia: $14.4 million (2.2%)
13. Hong Kong: $13.5 million (2.1%)
14. Japan: $13.4 million (2.1%)
15. Türkiye: $12.6 million (2%)
These 15 countries made up 75.3% of global fig imports in 2022. The fastest-growing fig importers since 2021 were Türkiye (up 50.6%), Hong Kong (up 40.5%), China (up 29.9%), and Russia (up 18.8%). The largest declines were seen in India (down 60.1%), the Netherlands (down 24.1%), France (down 19%), Germany (down 17.6%), and Italy (down 14.8%).
Leading Fig Importers in 2023
1. ООО ТД "РУСТОРГ" (10.33%, $155.68 million)
2. ТОО GRANDEZZA (6.08%, $91.63 million)
3. ООО "АГРО-АЛЬЯНС" (1.79%, $26.99 million)
4. ООО "АТР" (1.6%, $24.13 million)
5. ООО "БОНЕНКАМП" (1.58%, $23.83 million)
6. KARPOS GROUP XUSUSIY KORXONASI (1.54%, $23.2 million)
7. MOHEB MOHAMMAD SHAH LTD (1.42%, $21.42 million)
8. ООО"ВОСХОД" (1.41%, $21.18 million)
9. ООО "АЕОЛУС ТАЙР РУС" (1.33%, $20.1 million)
10. ООО "СП-СЕРВИС" (1.13%, $17.1 million)
Leading Fig Exporters in 2023
1. MAXAM TIRE SOLUTIONS CO., LIMITED (8.13%, $122.56 million)
2. MONGE AND C S P A (6.08%, $91.71 million)
3. TRIANGLE TYRE CO., LTD (1.85%, $27.89 million)
4. SIA "BOHNENKAMP" (1.75%, $26.45 million)
5. SAILUN (VIETNAM) CO., LTD (1.49%, $22.51 million)
6. РИН БАЛТИК ООО (1.39%, $20.93 million)
7. KANDAHAR TRADERS (1.38%, $20.73 million)
8. SRI SAI NATH AGRI INDUSTRIES PRIVATE LIMITED (1.36%, $20.44 million)
9. AEOLUS TYRE CO., LTD. (1.28%, $19.29 million)
10. ESTEE LAUDER BV (1%, $15.07 million)
These companies represent the top players in the fig import and export market for 2023.
Retrieve Global Trade Data and Monitor Market Trends
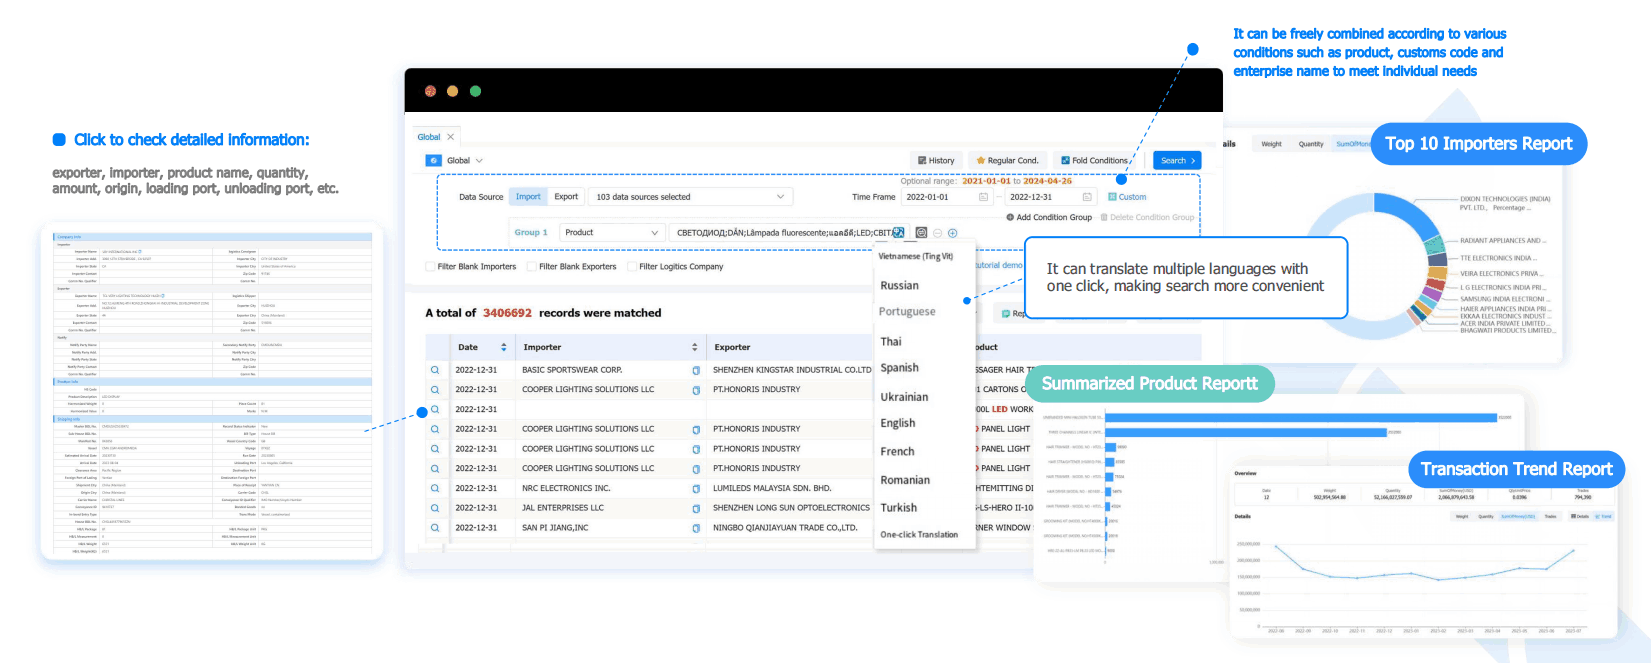
Tendata support one-click queries to track the global transaction details of specific products. Reflect the purchasing and supply activities throughout the entire supply chain and comprehensively display the state of the entire trade network.
Based on the statistical analysis of transaction data, view industry and product market trends to help businesses gain insights into market changes.
Tendata provides real-time, accurate, and detailed customs data, presenting the specifics of each transaction. Customized search criteria meet various filtering needs.

Category
Leave Message for Demo Request or Questions


 T-info
 T-discovery

 My
Tendata
 Market Analysis
 Customer
Development
 Competitor
Monitoring
 Customer Relationship


